UBS Results Presentation Deck
Investment Bank
USD m, except where indicated
Total revenues
Global Banking
Advisory
Capital Markets
Global Markets
Execution Services
Derivatives & Solutions
Financing
Credit loss expense / (release)
Operating expenses
Profit before tax
Cost / income ratio
3Q23
underlying
1,900
447
191
256
1,452
379
605
468
4
2,012
(116)
106%
3Q23
reported
2,151
698
191
507
1,452
379
605
468
4
2,377
(230)
111%
3Q22
reported
2,032
329
136
193
1,702
376
866
460
4
1,581
447
78%
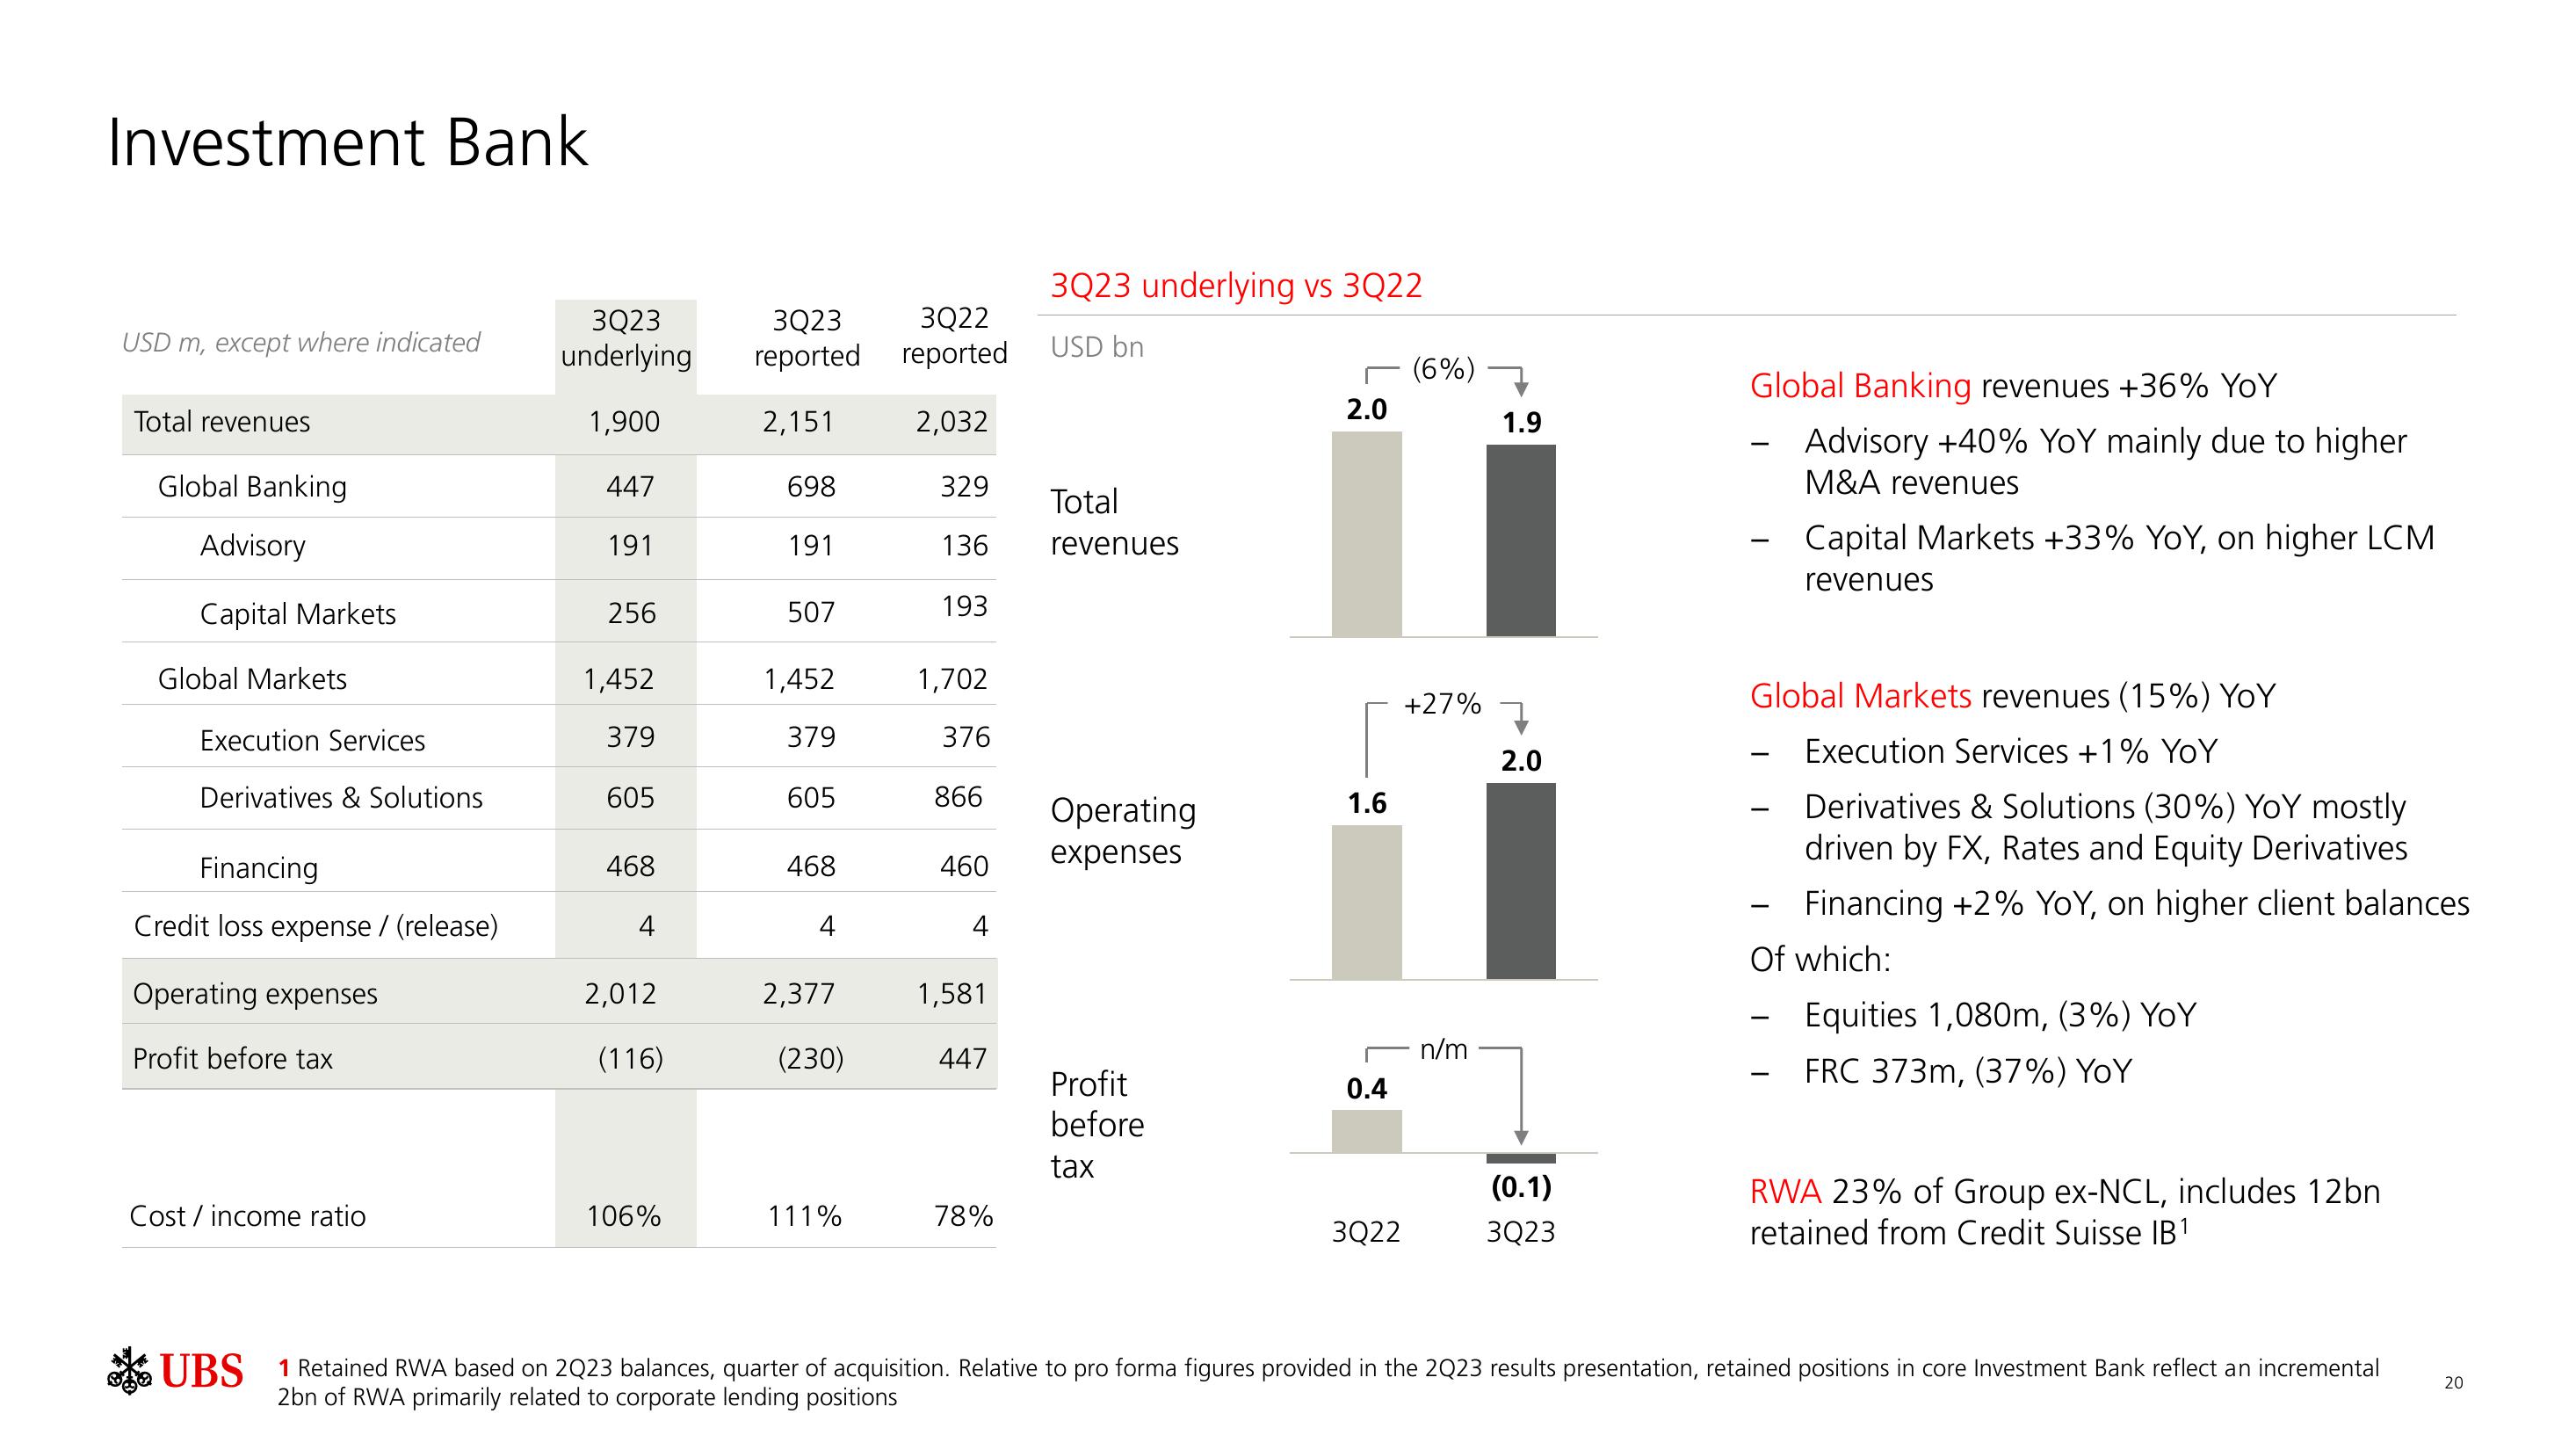
3Q23 underlying vs 3Q22
USD bn
Total
revenues
Operating
expenses
Profit
before
tax
2.0
1.6
0.4
3Q22
(6%)
+27%
n/m
1.9
2.0
(0.1)
3Q23
Global Banking revenues +36% YoY
Advisory +40% YoY mainly due to higher
M&A revenues
Capital Markets +33% YoY, on higher LCM
revenues
Global Markets revenues (15%) YOY
Execution Services +1% YoY
Derivatives & Solutions (30%) YoY mostly
driven by FX, Rates and Equity Derivatives
Financing +2% YOY, on higher client balances
Of which:
-
Equities 1,080m, (3%) YoY
FRC 373m, (37%) YoY
RWA 23% of Group ex-NCL, includes 12bn
retained from Credit Suisse IB¹
UBS 1 Retained RWA based on 2023 balances, quarter of acquisition. Relative to pro forma figures provided in the 2Q23 results presentation, retained positions in core Investment Bank reflect an incremental
2bn of RWA primarily related to corporate lending positions
20View entire presentation