GlobalFoundries Results Presentation Deck
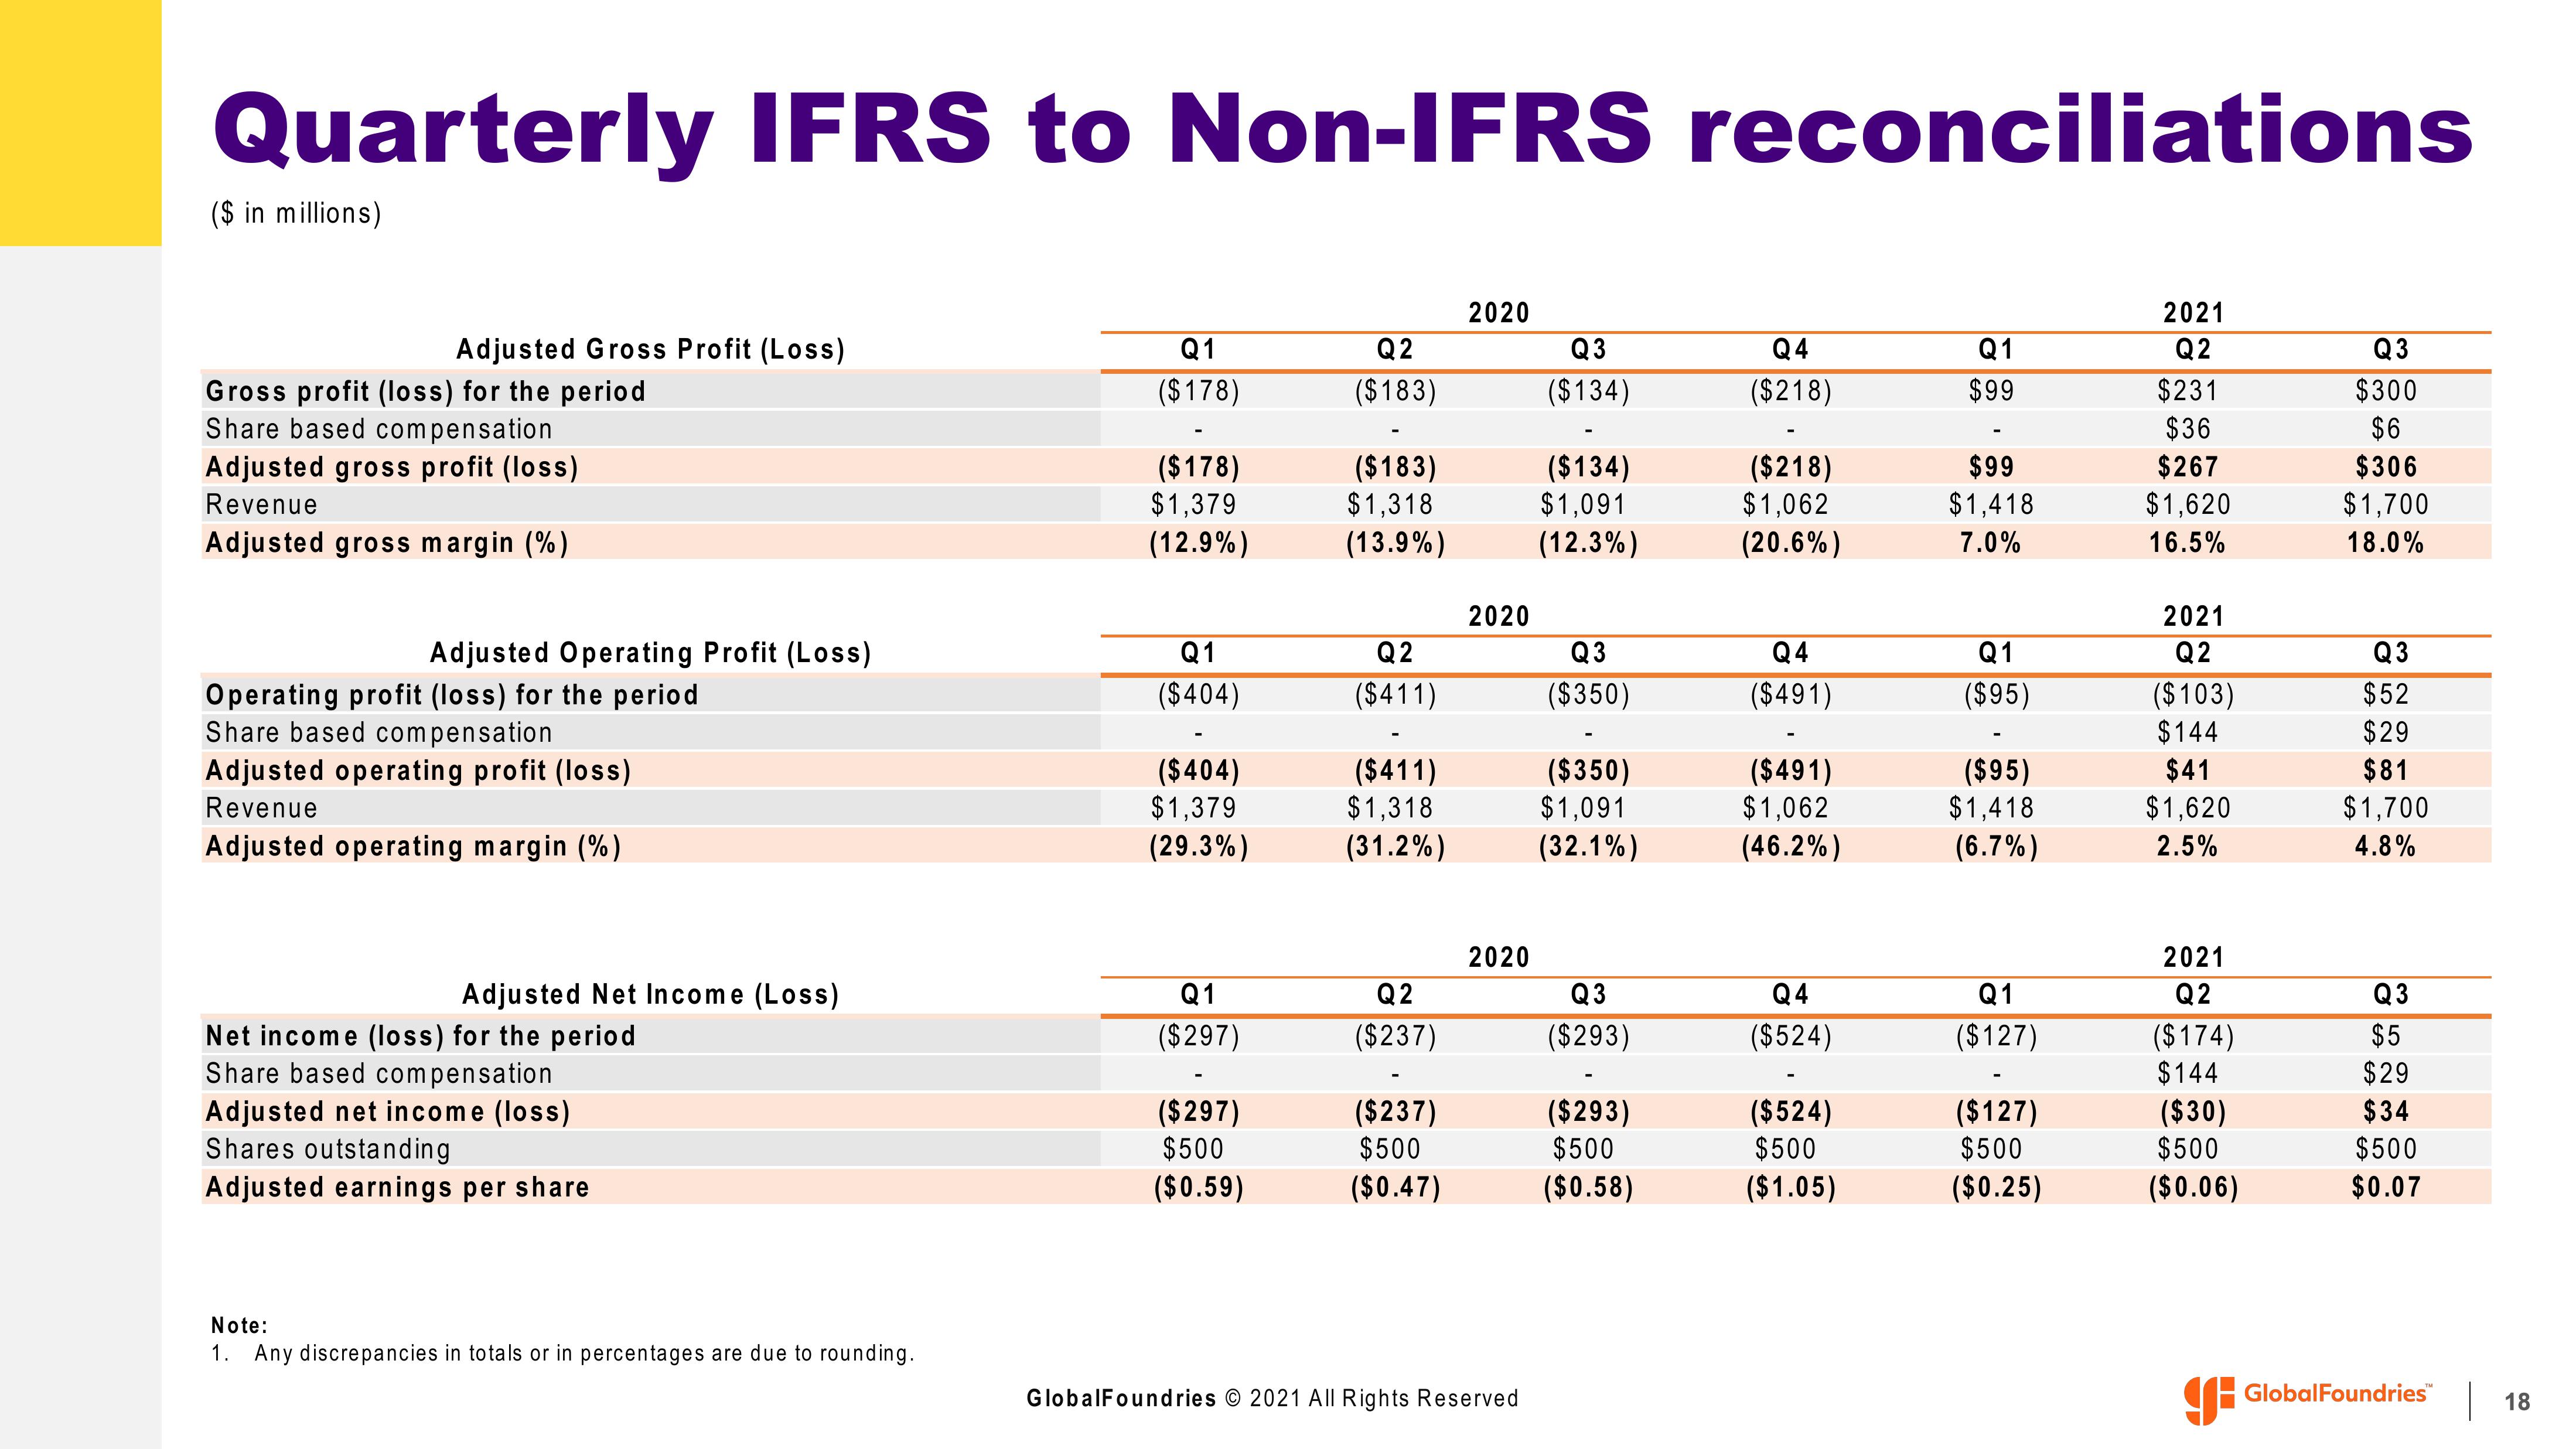
Quarterly IFRS to Non-IFRS reconciliations
($ in millions)
Adjusted Gross Profit (Loss)
Gross profit (loss) for the period
Share based compensation
Adjusted gross profit (loss)
Revenue
Adjusted gross margin (%)
Adjusted Operating Profit (Loss)
Operating profit (loss) for the period
Share based compensation
Adjusted operating profit (loss)
Revenue
Adjusted operating margin (%)
Adjusted Net Income (Loss)
Net income (loss) for the period
Share based compensation
Adjusted net income (loss)
Shares outstanding
Adjusted earnings per share
Note:
1. Any discrepancies in totals or in percentages are due to rounding.
Q1
($178)
($178)
$1,379
(12.9%)
Q1
($404)
($404)
$1,379
(29.3%)
Q1
($297)
($297)
$500
($0.59)
Q2
($183)
($183)
$1,318
(13.9%)
Q2
($411)
($411)
$1,318
(31.2%)
Q2
($237)
($237)
$500
($0.47)
2020
2020
2020
GlobalFoundries © 2021 All Rights Reserved
Q3
($134)
($134)
$1,091
(12.3%)
Q3
($350)
($350)
$1,091
(32.1%)
Q3
($293)
($293)
$500
($0.58)
Q4
($218)
($218)
$1,062
(20.6%)
Q4
($491)
($491)
$1,062
(46.2%)
Q4
($524)
($524)
$500
($1.05)
Q1
$99
$99
$1,418
7.0%
Q1
($95)
($95)
$1,418
(6.7%)
Q1
($127)
($127)
$500
($0.25)
2021
Q2
$231
$36
$267
$1,620
16.5%
2021
Q2
($103)
$144
$41
$1,620
2.5%
2021
Q2
($174)
$144
($30)
$500
($0.06)
Q3
$300
$6
$306
$1,700
18.0%
Q3
$52
$29
$81
$1,700
4.8%
Q3
$5
$29
$34
$500
$0.07
GlobalFoundries™
18View entire presentation