Fiverr Investor Presentation Deck
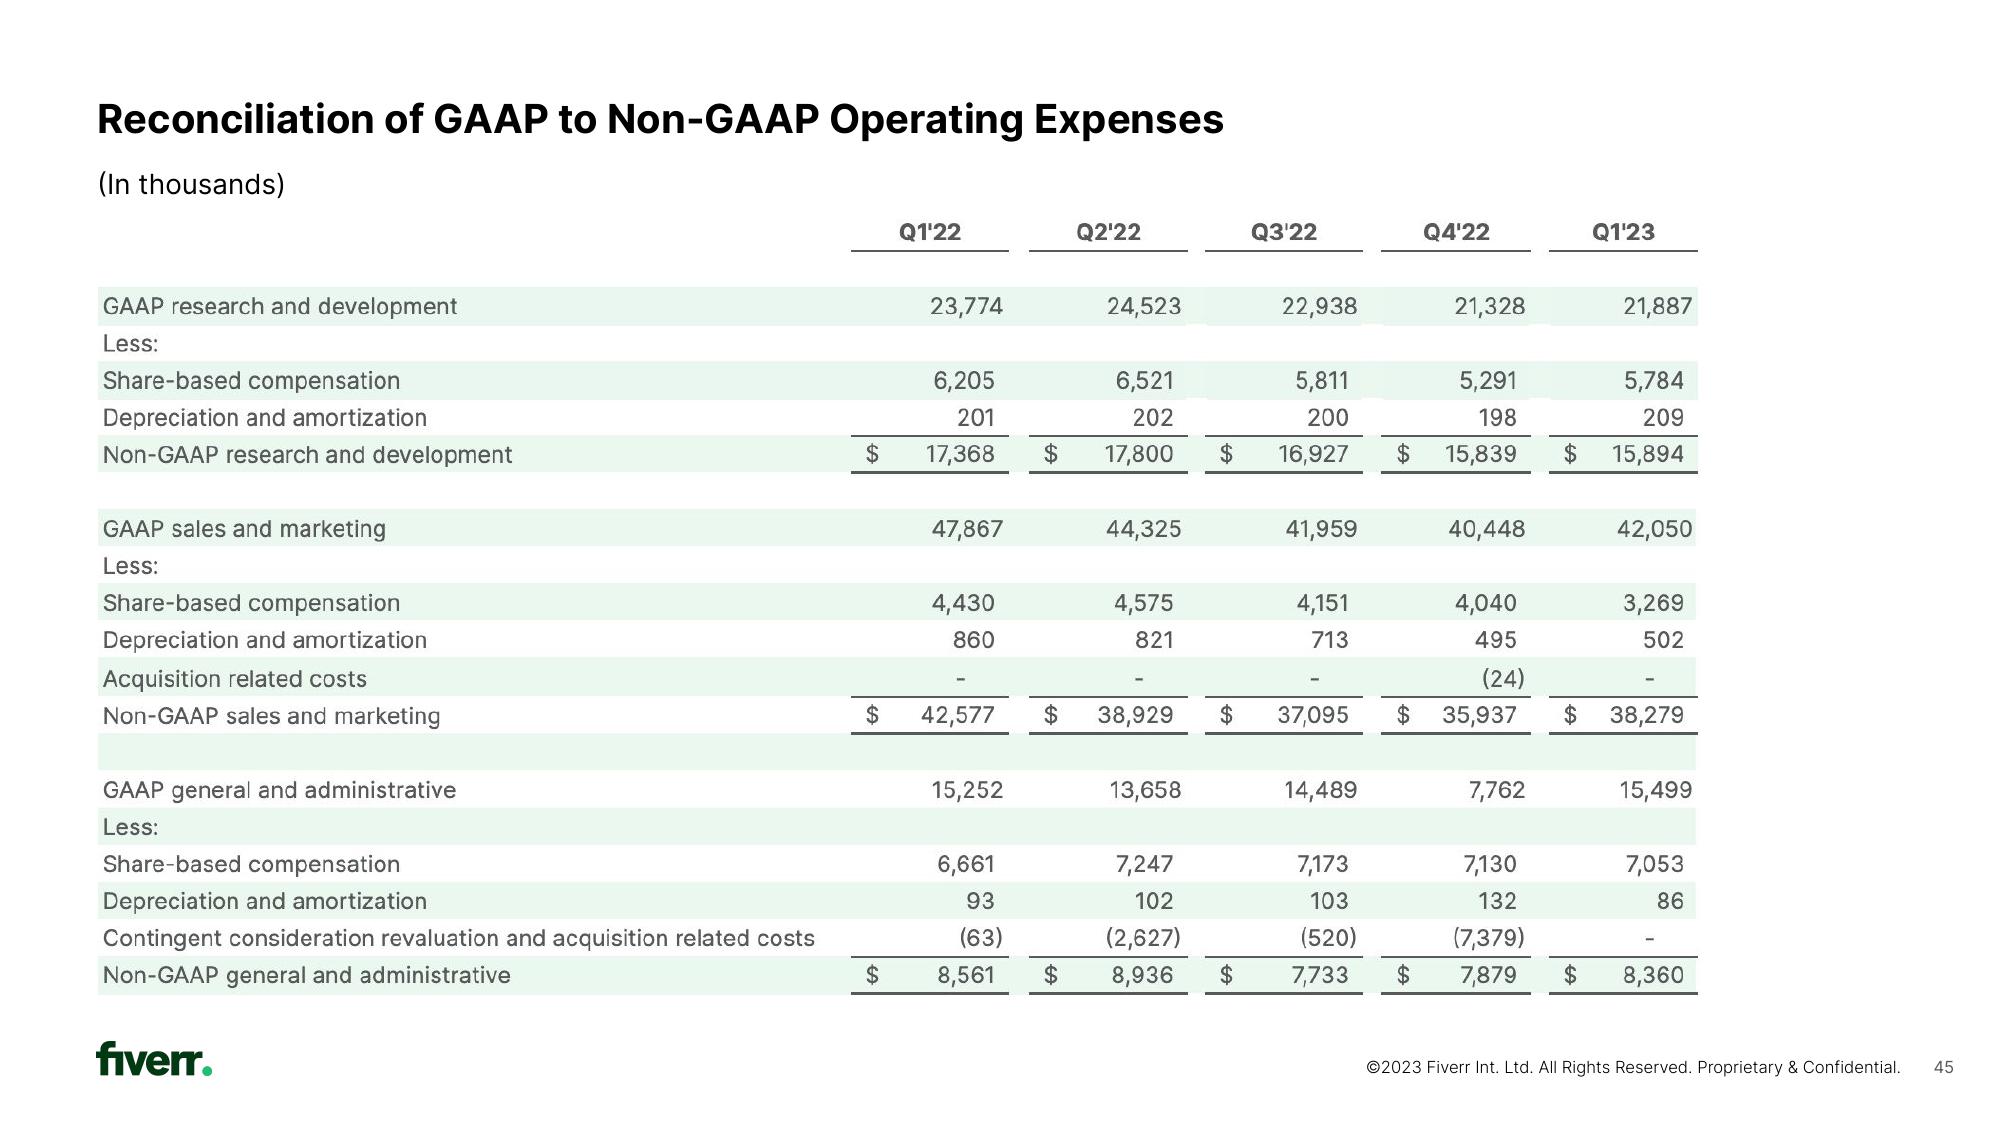
Reconciliation of GAAP to Non-GAAP Operating Expenses
(In thousands)
GAAP research and development
Less:
Share-based compensation
Depreciation and amortization
Non-GAAP research and development
GAAP sales and marketing
Less:
Share-based compensation
Depreciation and amortization
Acquisition related costs
Non-GAAP sales and marketing
GAAP general and administrative
Less:
Share-based compensation
Depreciation and amortization
Contingent consideration revaluation and acquisition related costs
Non-GAAP general and administrative
fiverr.
$
$
$
Q1'22
23,774
6,205
201
17,368
47,867
4,430
860
42,577
15,252
6,661
93
(63)
8,561
$
Q2'22
6,521
202
$ 17,800
$
24,523
44,325
4,575
821
38,929
13,658
7,247
102
(2,627)
8,936
Q3'22
22,938
5,811
200
$ 16,927
$
41,959
4,151
713
$ 37,095 $
14,489
7,173
103
(520)
7,733
Q4'22
5,291
198
$ 15,839
$
21,328
40,448
4,040
495
(24)
35,937
7,762
$
Q1¹23
7,130
132
(7,379)
7,879 $
21,887
5,784
209
15,894
42,050
3,269
502
$ 38,279
15,499
7,053
86
8,360
Ⓒ2023 Fiverr Int. Ltd. All Rights Reserved. Proprietary & Confidential.
45View entire presentation