Blend Results Presentation Deck
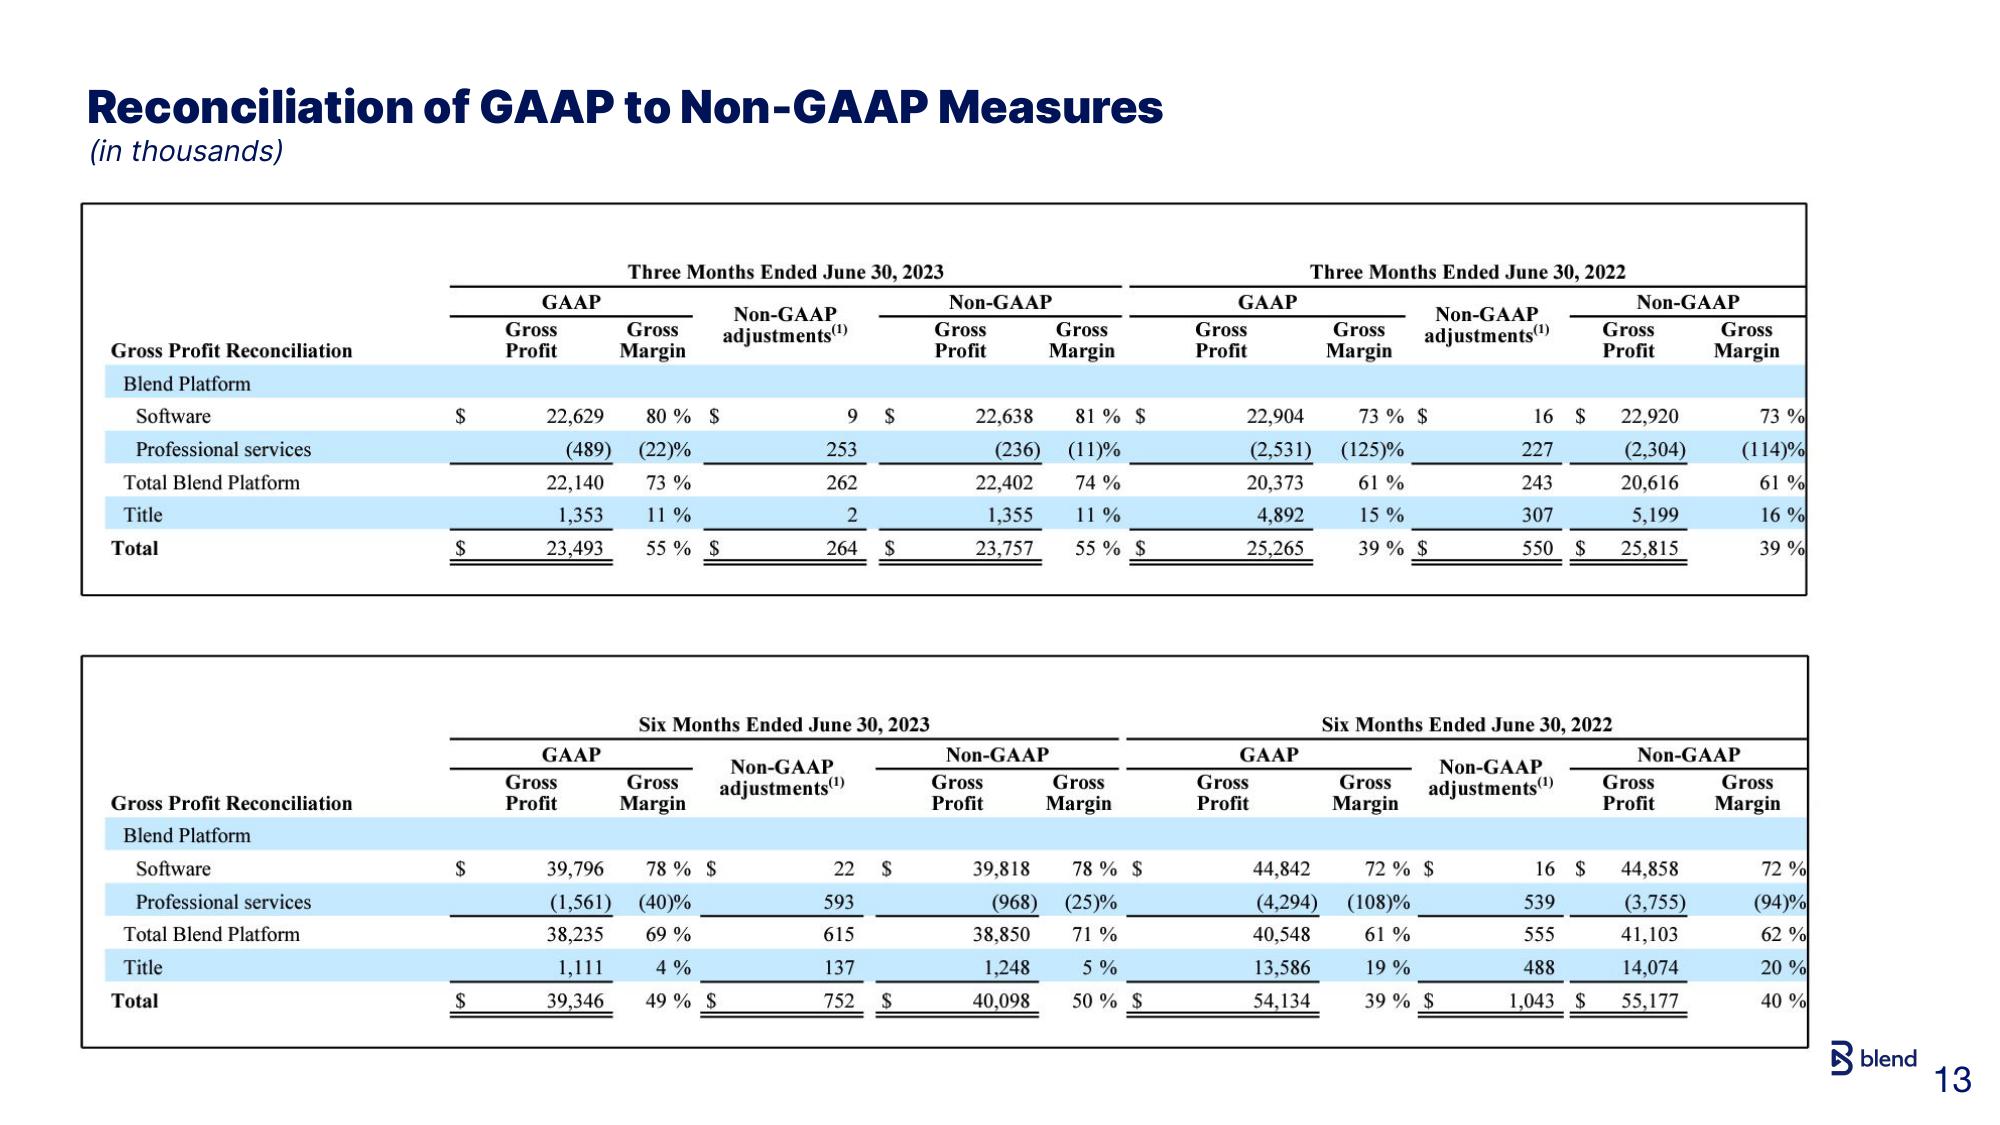
Reconciliation of GAAP to Non-GAAP Measures
(in thousands)
Gross Profit Reconciliation
Blend Platform
Software
Professional services
Total Blend Platform
Title
Total
Gross Profit Reconciliation
Blend Platform
Software
Professional services
Total Blend Platform
Title
Total
$
$
$
$
GAAP
Gross
Profit
22,140
1,353
23,493
22,629 80% $
(489)
(22)%
73 %
11%
55 % $
GAAP
Three Months Ended June 30, 2023
Non-GAAP
adjustments (¹)
Gross
Profit
Gross
Margin
Gross
Margin
9
253
262
2
264
39,796 78% S
(1,561) (40)%
38,235 69%
1,111 4%
49% $
39,346
Six Months Ended June 30, 2023
Non-GAAP
adjustments (¹)
$
$
593
615
137
752
22 $
$
Non-GAAP
Gross
Profit
22,638
(236)
22,402
1,355
23,757
Gross
Margin
Non-GAAP
Gross
Profit
81% $
(11)%
74 %
11%
55% $
Gross
Margin
39,818
(968) (25)%
38,850
1,248
40,098
78% $
71%
5%
50% $
GAAP
Gross
Profit
22,904
(2,531)
20,373
4,892
25,265
GAAP
Three Months Ended June 30, 2022
Non-GAAP
adjustments (¹)
Gross
Profit
44,842
(4,294)
40,548
13,586
54,134
Gross
Margin
73 % $
(125)%
61%
15 %
39 % $
Gross
Margin
16 $
227
243
307
550
Six Months Ended June 30, 2022
Non-GAAP
adjustments (¹)
72% $
(108)%
61%
19%
39% $
16 $
539
555
488
1,043 $
Non-GAAP
Gross
Profit
22,920
(2,304)
20,616
5,199
25,815
Non-GAAP
Gross
Profit
Gross
Margin
44,858
(3,755)
41,103
14,074
55,177
73%
(114)%
61%
16 %
39 %
Gross
Margin
72 %
(94)%
62%
20%
40 %
blend
13View entire presentation