Analyst Day Presentation
32
33
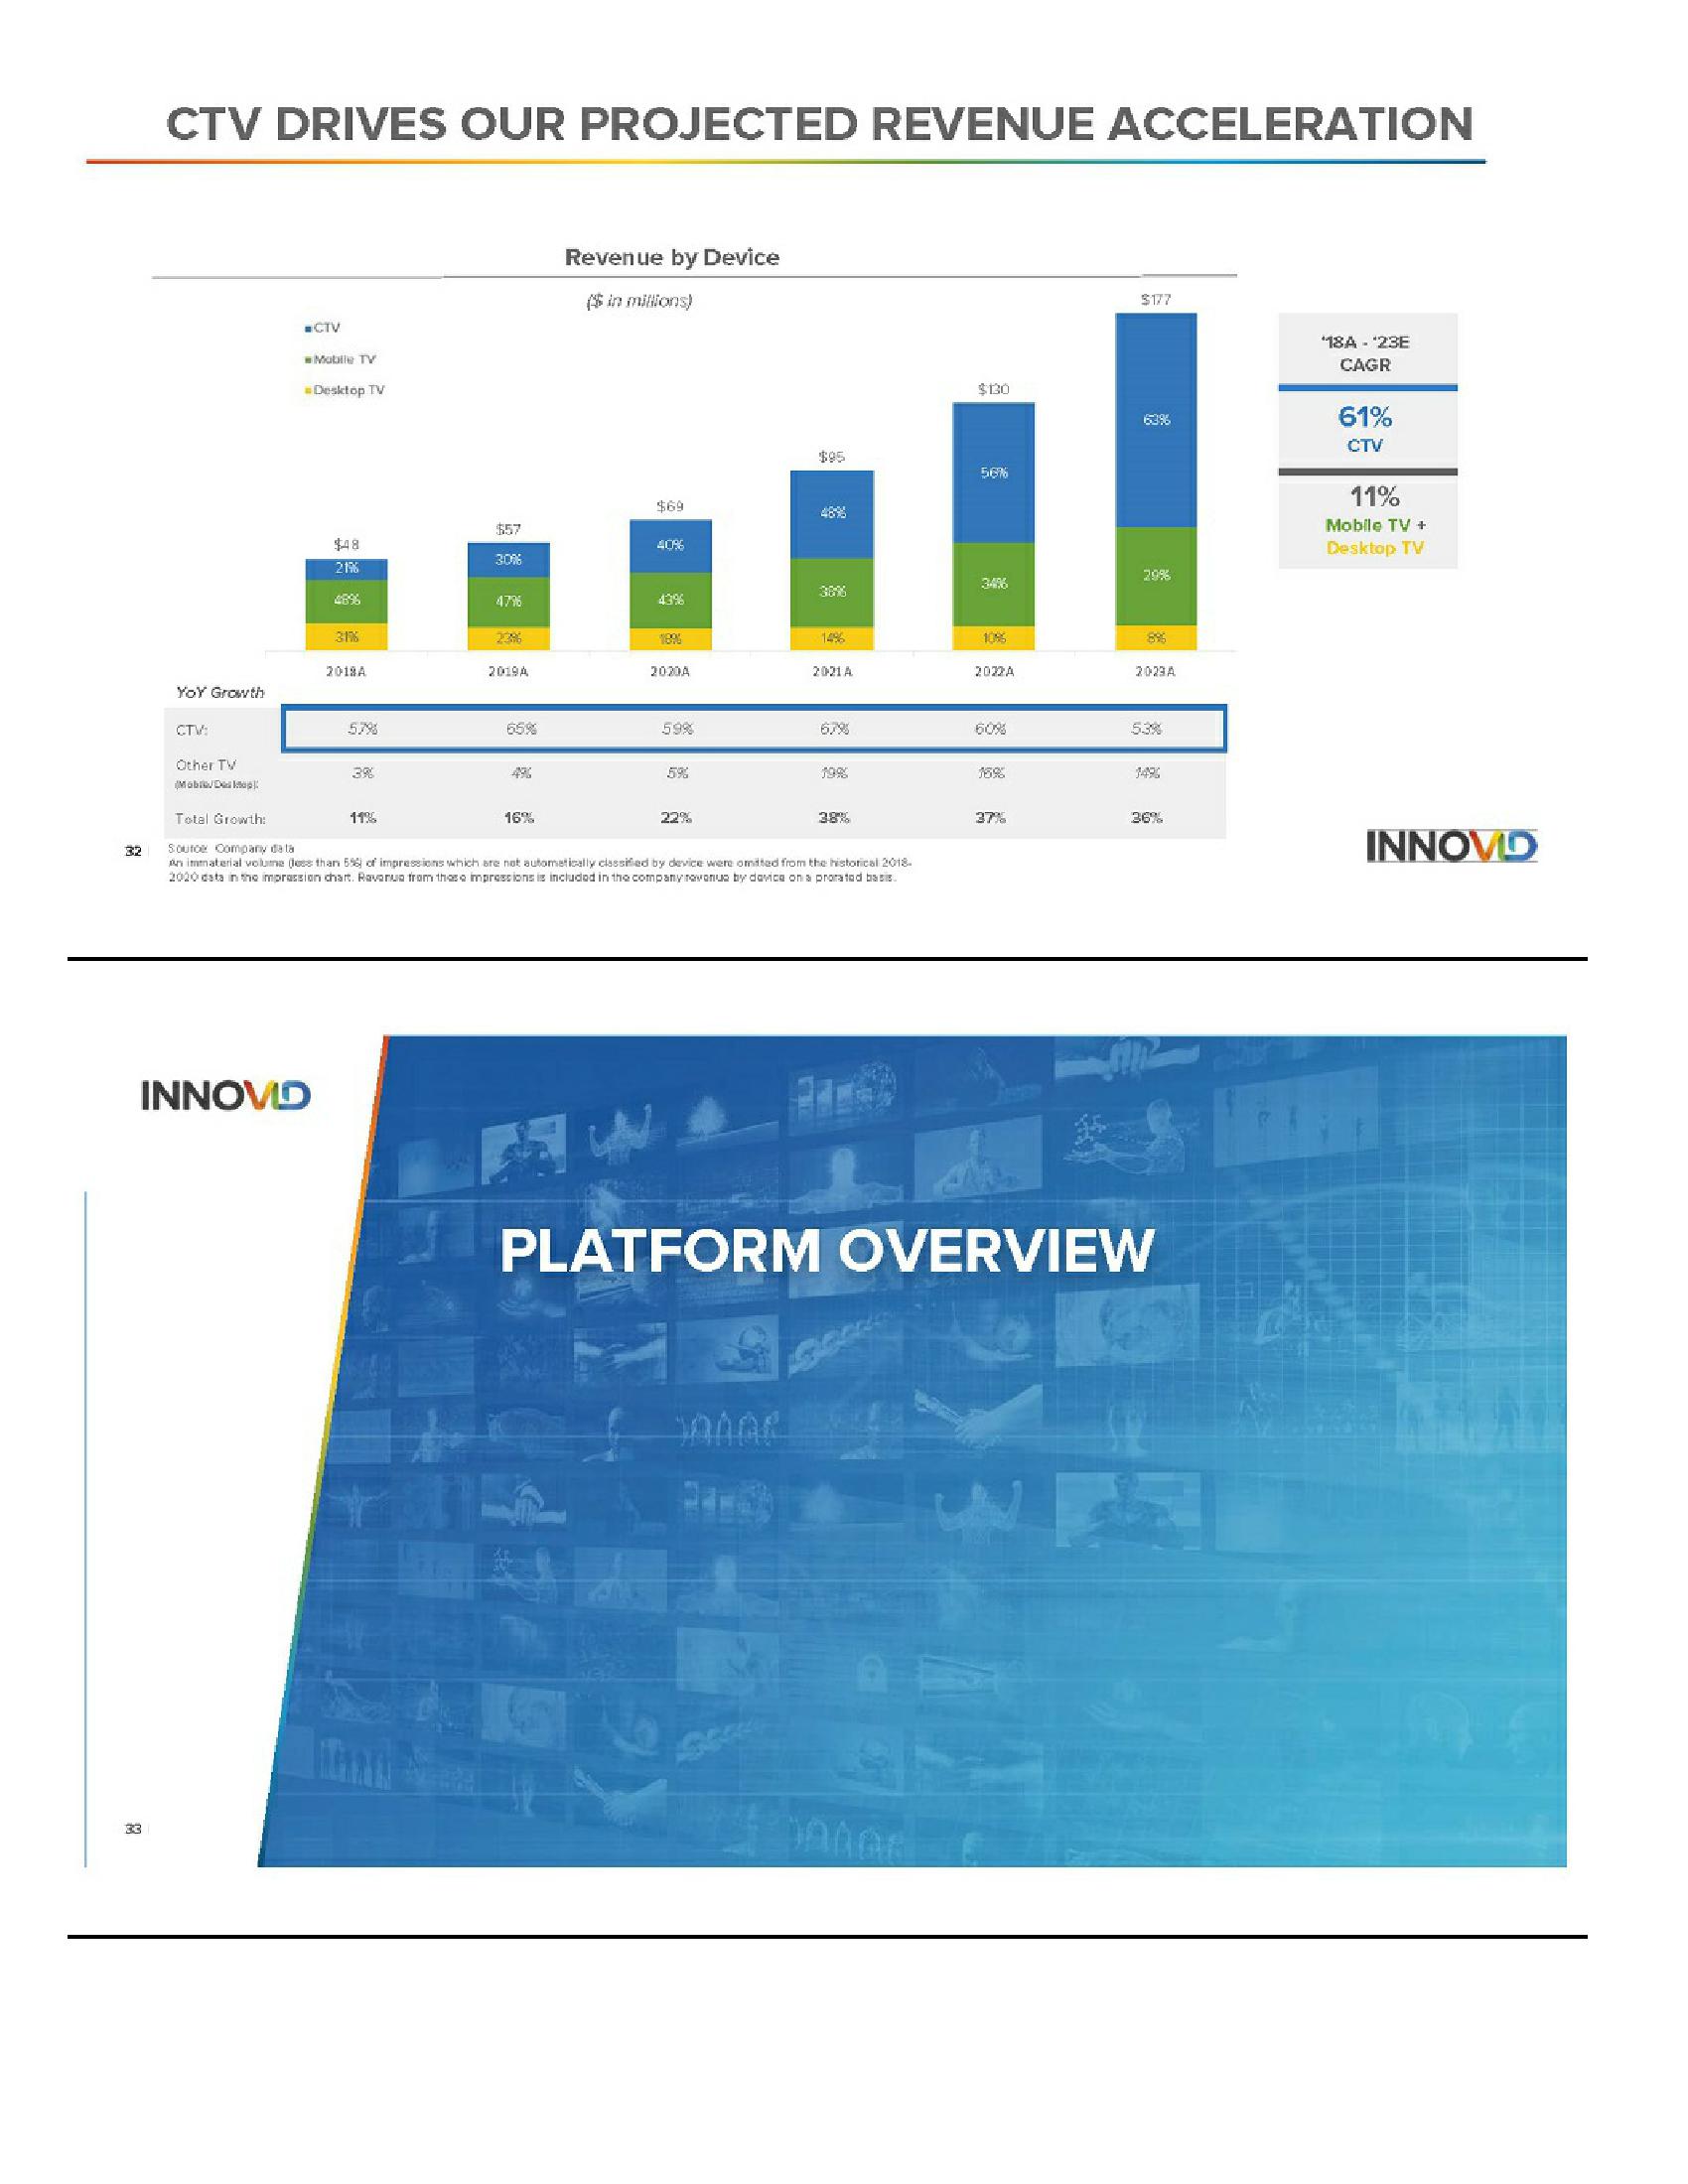
CTV DRIVES OUR PROJECTED REVENUE ACCELERATION
YOY Growth
CTV:
Other TV
Mobre Dep
■CTV
Mobile TV
INNOVID
Desktop TV
$48
21%
46%
3176
2018A
57%
3%
11%
$57
30%
4796
23%6
2019A
65%
16%
Revenue by Device
($in millions)
$69
40%
2020A
59%
22%
$95
30%
10002
14%
2021 A
679
19%
Total Growth:
Source Company data
An immaterial volume (less than 5% of impressions which are not automatically classified by device were omitted from the historical 2018-
2020 data in the impression chart. Ravenue from these impressions is included in the company revenue by device on a protated basis.
38%
$130
56%
3476
10%
2022A
60%
15%
37%
$177
63%
29%
8%
2029A
53%
36%
PLATFORM OVERVIEW
¹18A - ¹23E
CAGR
61%
CTV
11%
Mobile TV +
Desktop TV
INNOVIDView entire presentation