First Citizens BancShares Results Presentation Deck
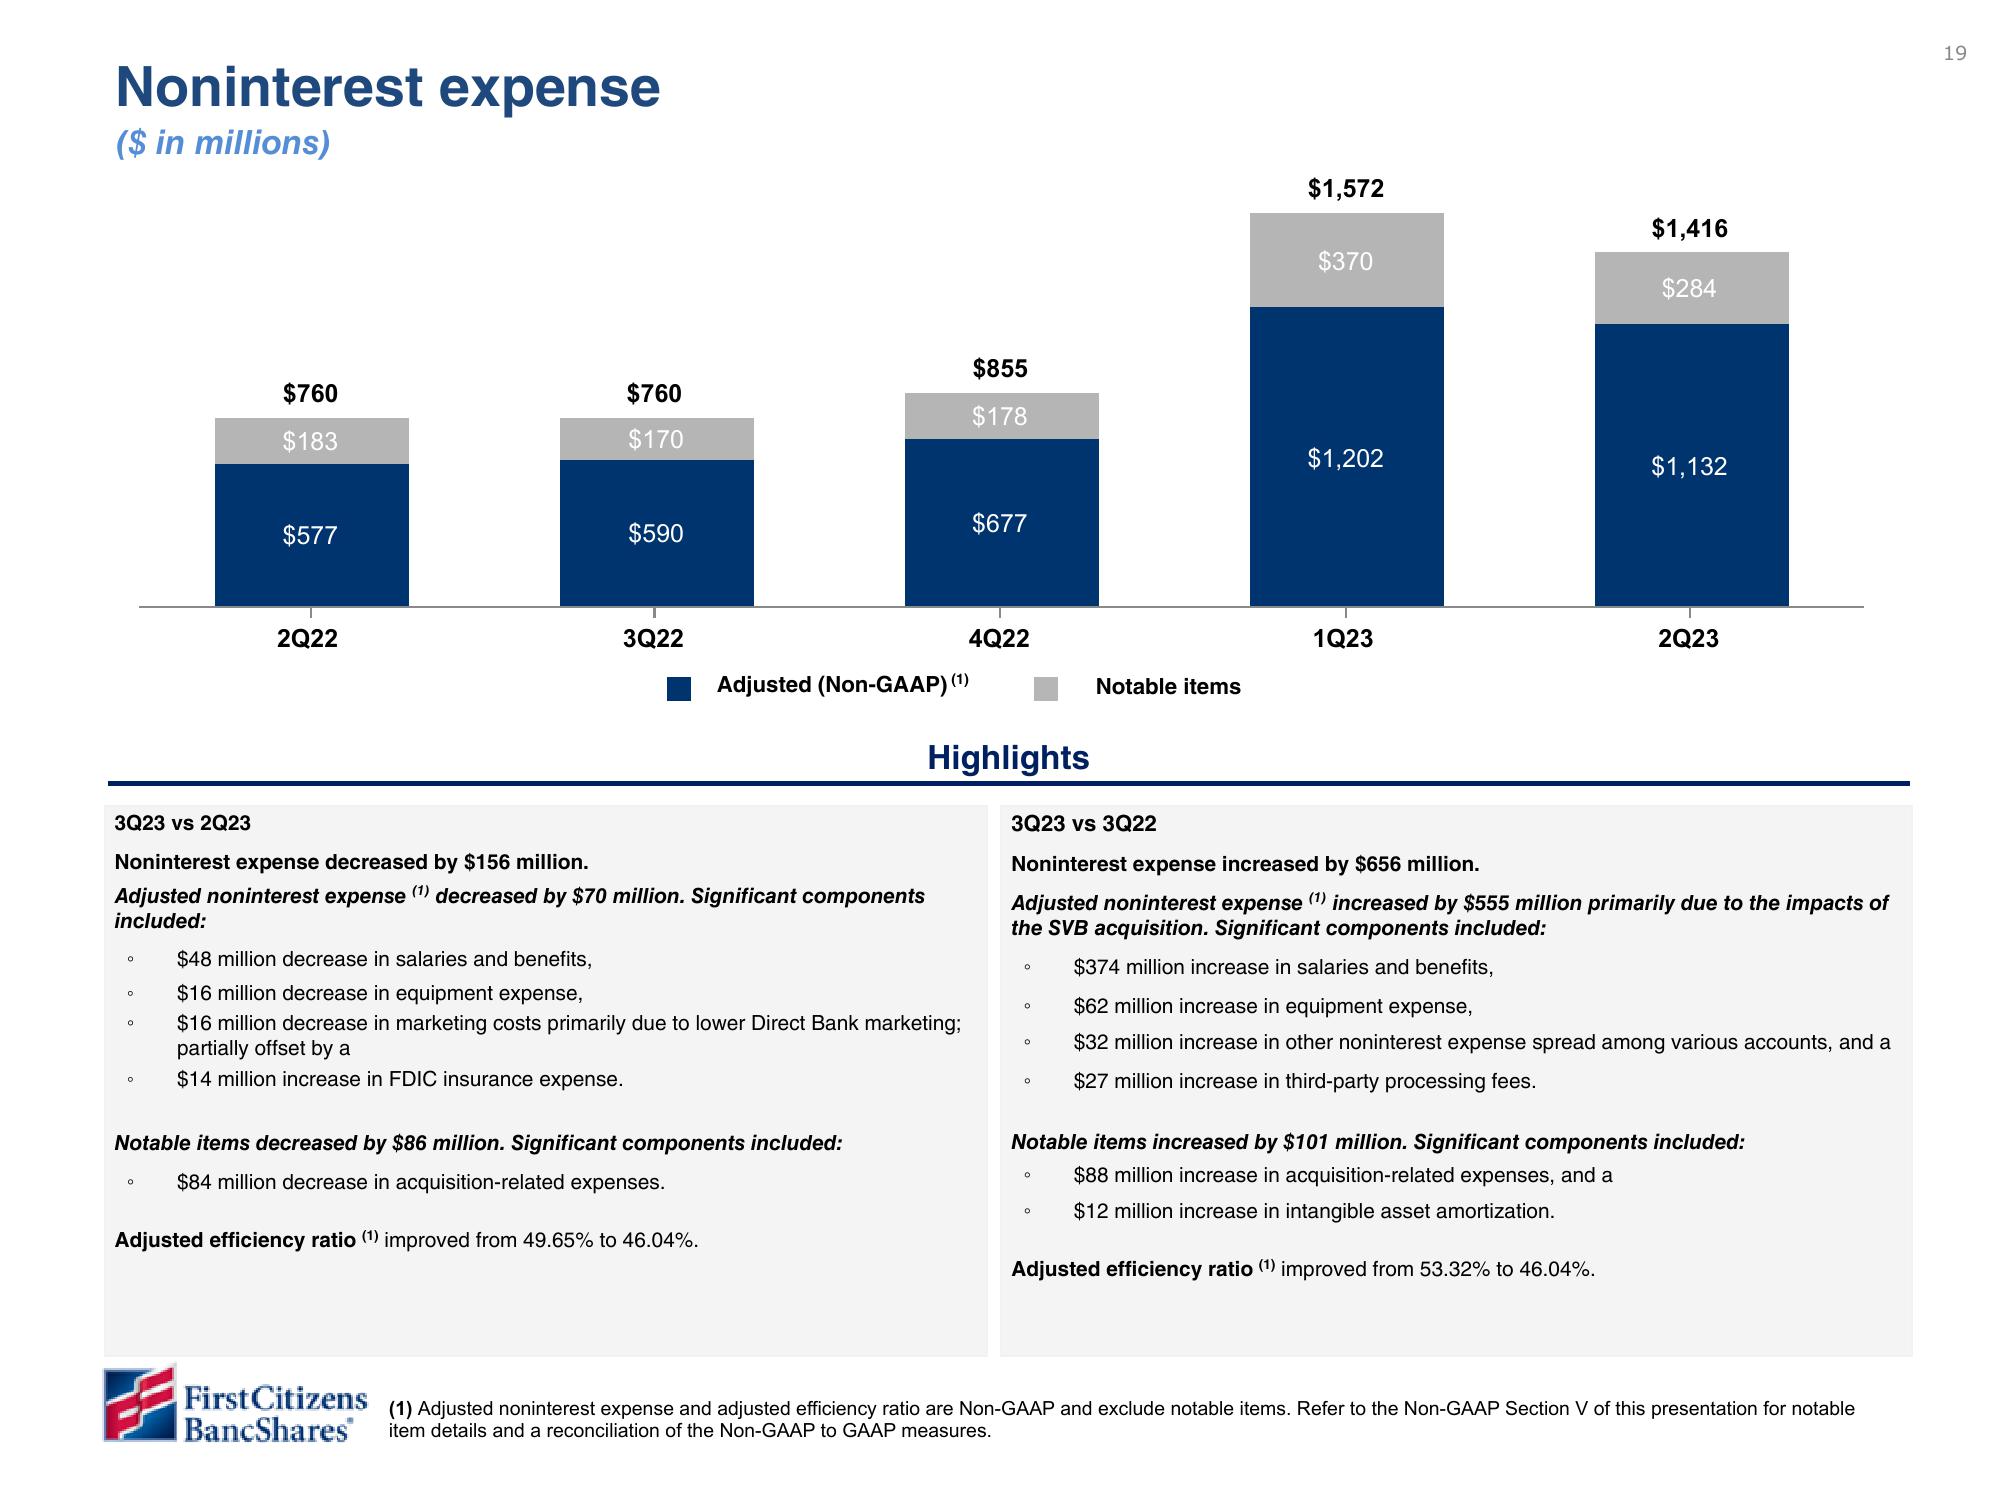
Noninterest expense
($ in millions)
O
o
O
$760
$183
$577
0
2Q22
3Q23 vs 2Q23
Noninterest expense decreased by $156 million.
Adjusted noninterest expense (¹) decreased by $70 million. Significant components
included:
$760
$170
$590
3Q22
First Citizens
BancShares
Adjusted (Non-GAAP) (¹)
Notable items decreased by $86 million. Significant components included:
$84 million decrease in acquisition-related expenses.
Adjusted efficiency ratio (¹) improved from 49.65% to 46.04%.
$48 million decrease in salaries and benefits,
$16 million decrease in equipment expense,
$16 million decrease in marketing costs primarily due to lower Direct Bank marketing;
partially offset by a
$14 million increase in FDIC insurance expense.
$855
$178
$677
4Q22
Highlights
O
O
0
O
Notable items
O
$1,572
0
$370
3Q23 vs 3Q22
Noninterest expense increased by $656 million.
Adjusted noninterest expense (¹) increased by $555 million primarily due to the impacts of
the SVB acquisition. Significant components included:
$374 million increase in salaries and benefits,
$62 million increase in equipment expense,
$32 million increase in other noninterest expense spread among various accounts, and a
$27 million increase in third-party processing fees.
$1,202
1Q23
$1,416
$284
$1,132
2Q23
Notable items increased by $101 million. Significant components included:
$88 million increase in acquisition-related expenses, and a
$12 million increase in intangible asset amortization.
Adjusted efficiency ratio (¹) improved from 53.32% to 46.04%.
(1) Adjusted noninterest expense and adjusted efficiency ratio are Non-GAAP and exclude notable items. Refer to the Non-GAAP Section V of this presentation for notable
item details and a reconciliation of the Non-GAAP to GAAP measures.
19View entire presentation