BAT Results Presentation Deck
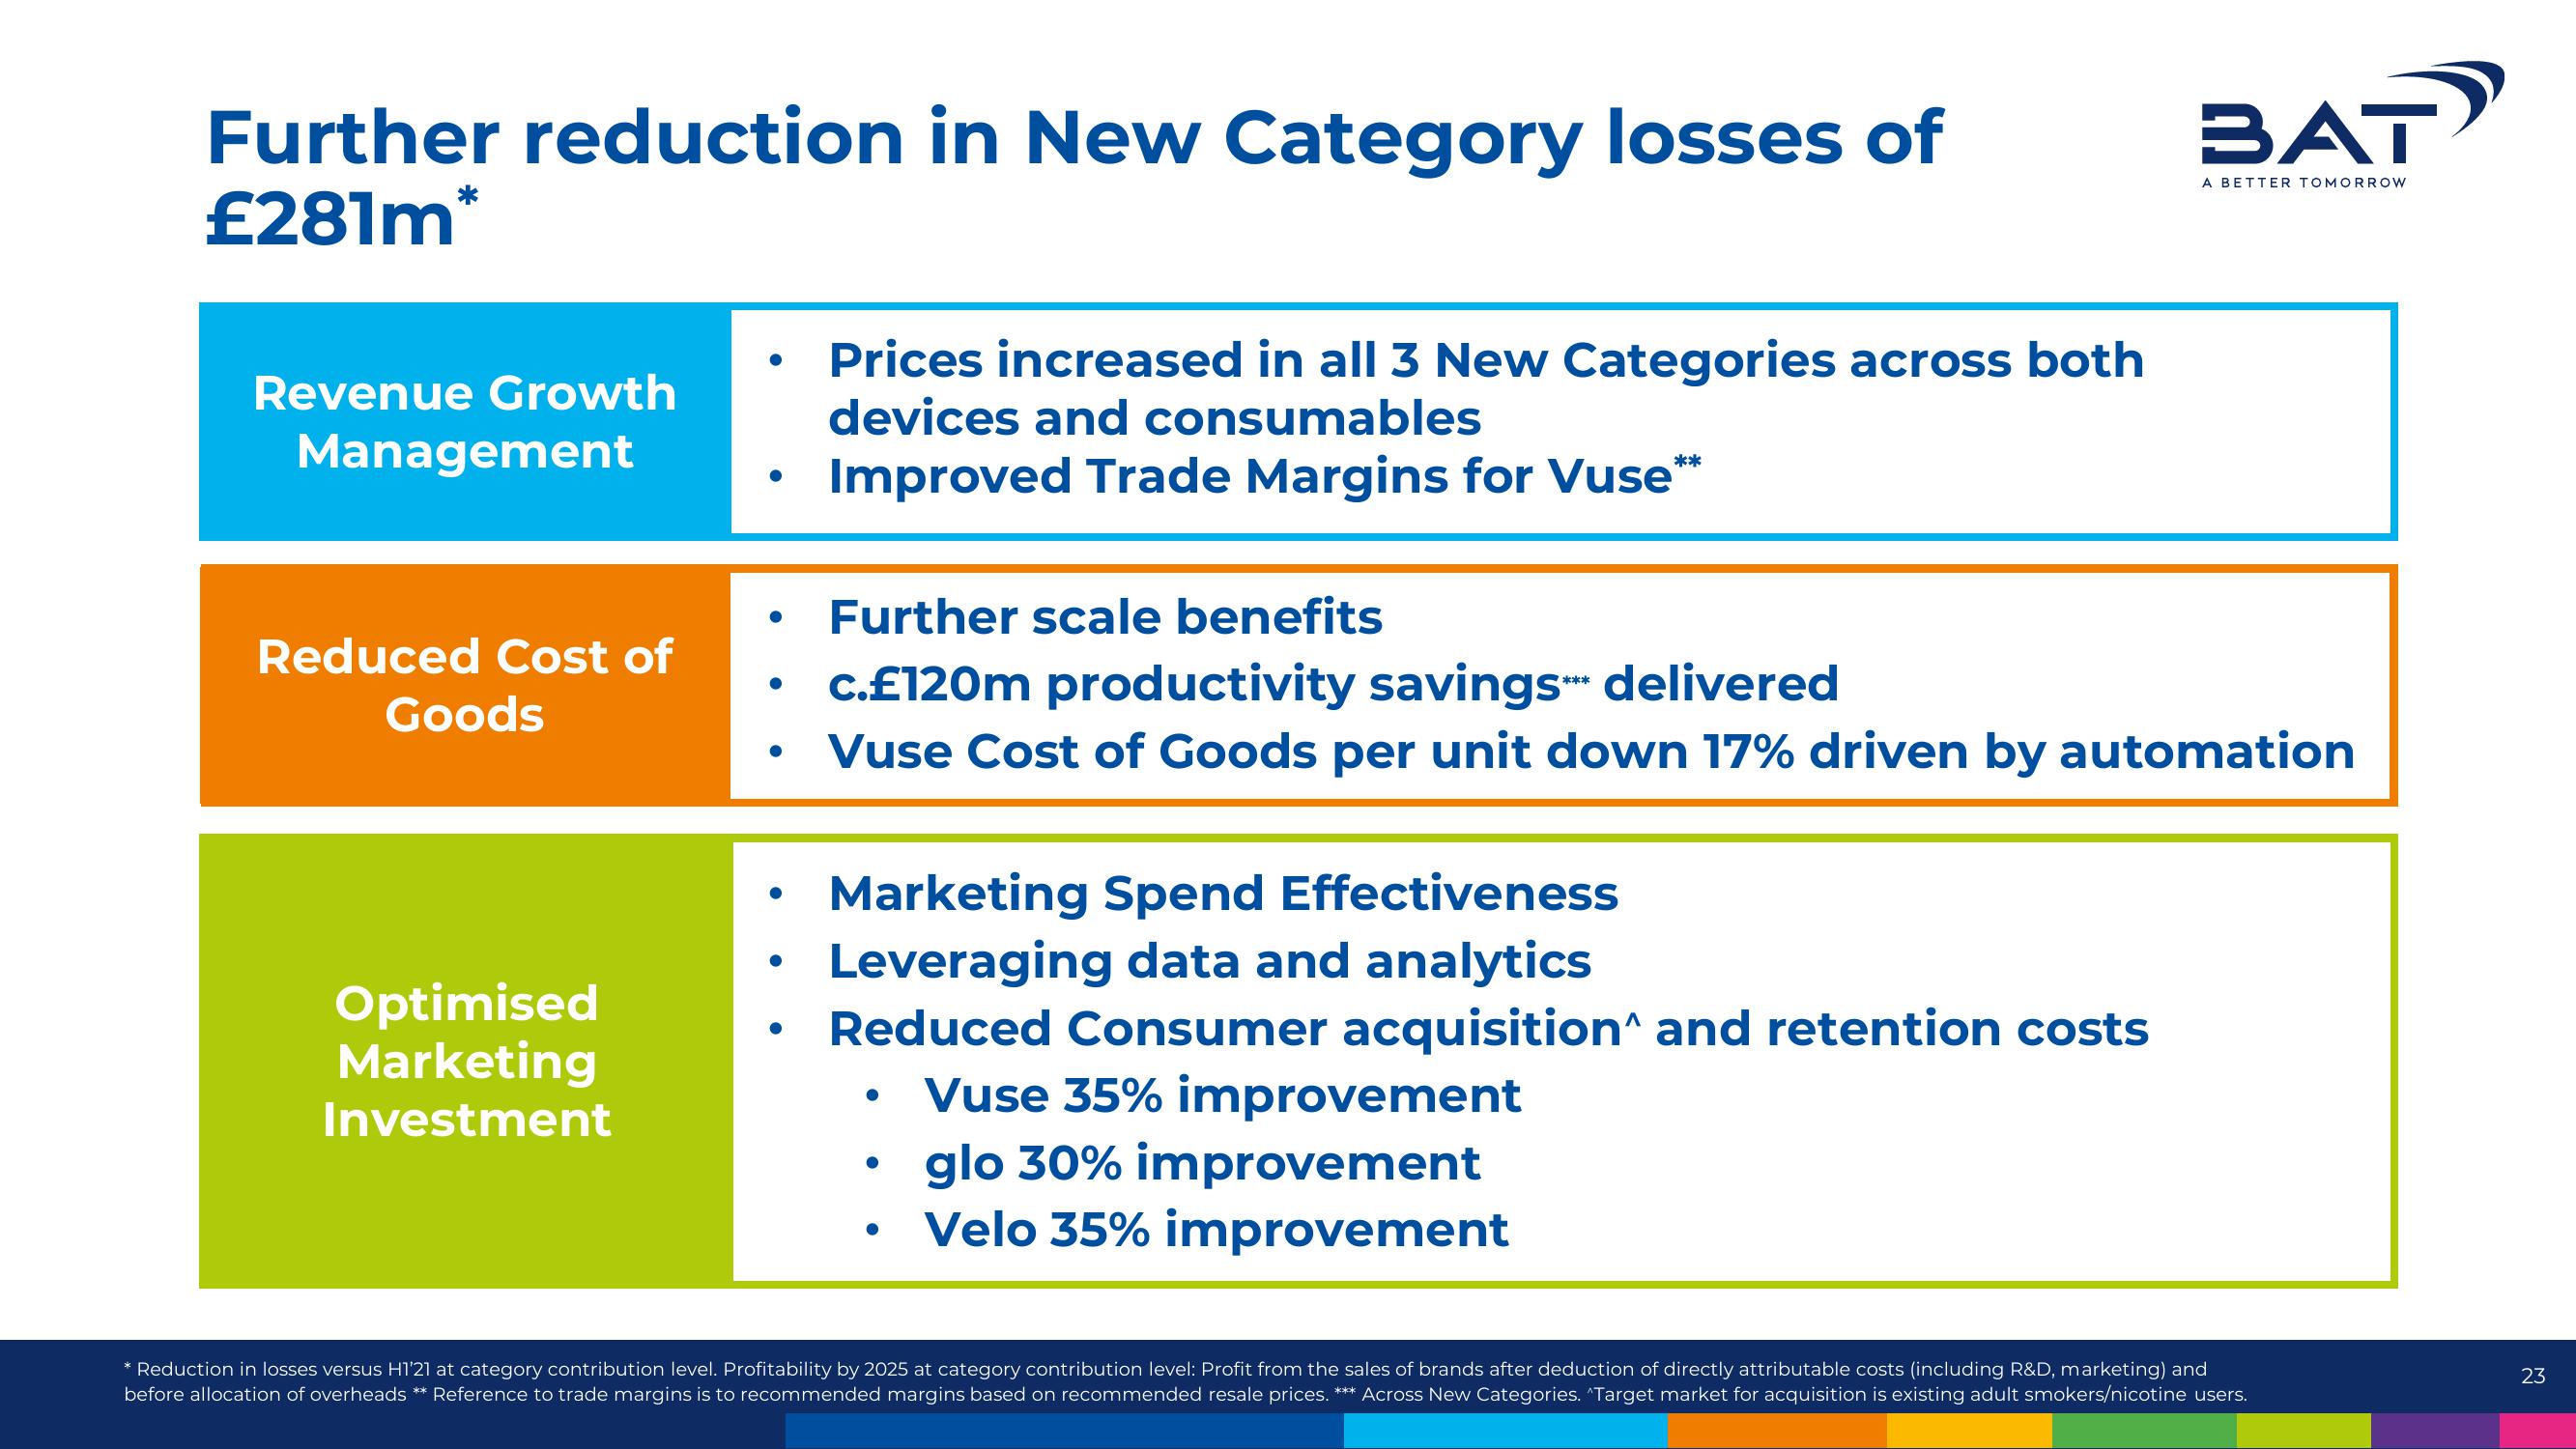
Further reduction in New Category losses of
£281m*
Revenue Growth
Management
Reduced Cost of
Goods
Optimised
Marketing
Investment
●
●
●
●
Prices increased in all 3 New Categories across both
devices and consumables
Improved Trade Margins for Vuse***
Further scale benefits
c.£120m productivity savings delivered
Vuse Cost of Goods per unit down 17% driven by automation
Marketing Spend Effectiveness
Leveraging data and analytics
Reduced Consumer acquisition^ and retention costs
●
****
Vuse 35% improvement
glo 30% improvement
Velo 35% improvement
BAT
A BETTER TOMORROW
* Reduction in losses versus H1'21 at category contribution level. Profitability by 2025 at category contribution level: Profit from the sales of brands after deduction of directly attributable costs (including R&D, marketing) and
before allocation of overheads ** Reference to trade margins is to recommended margins based on recommended resale prices. *** Across New Categories. Target market for acquisition is existing adult smokers/nicotine users.
23View entire presentation