Azerion SPAC Presentation Deck
M&A track record
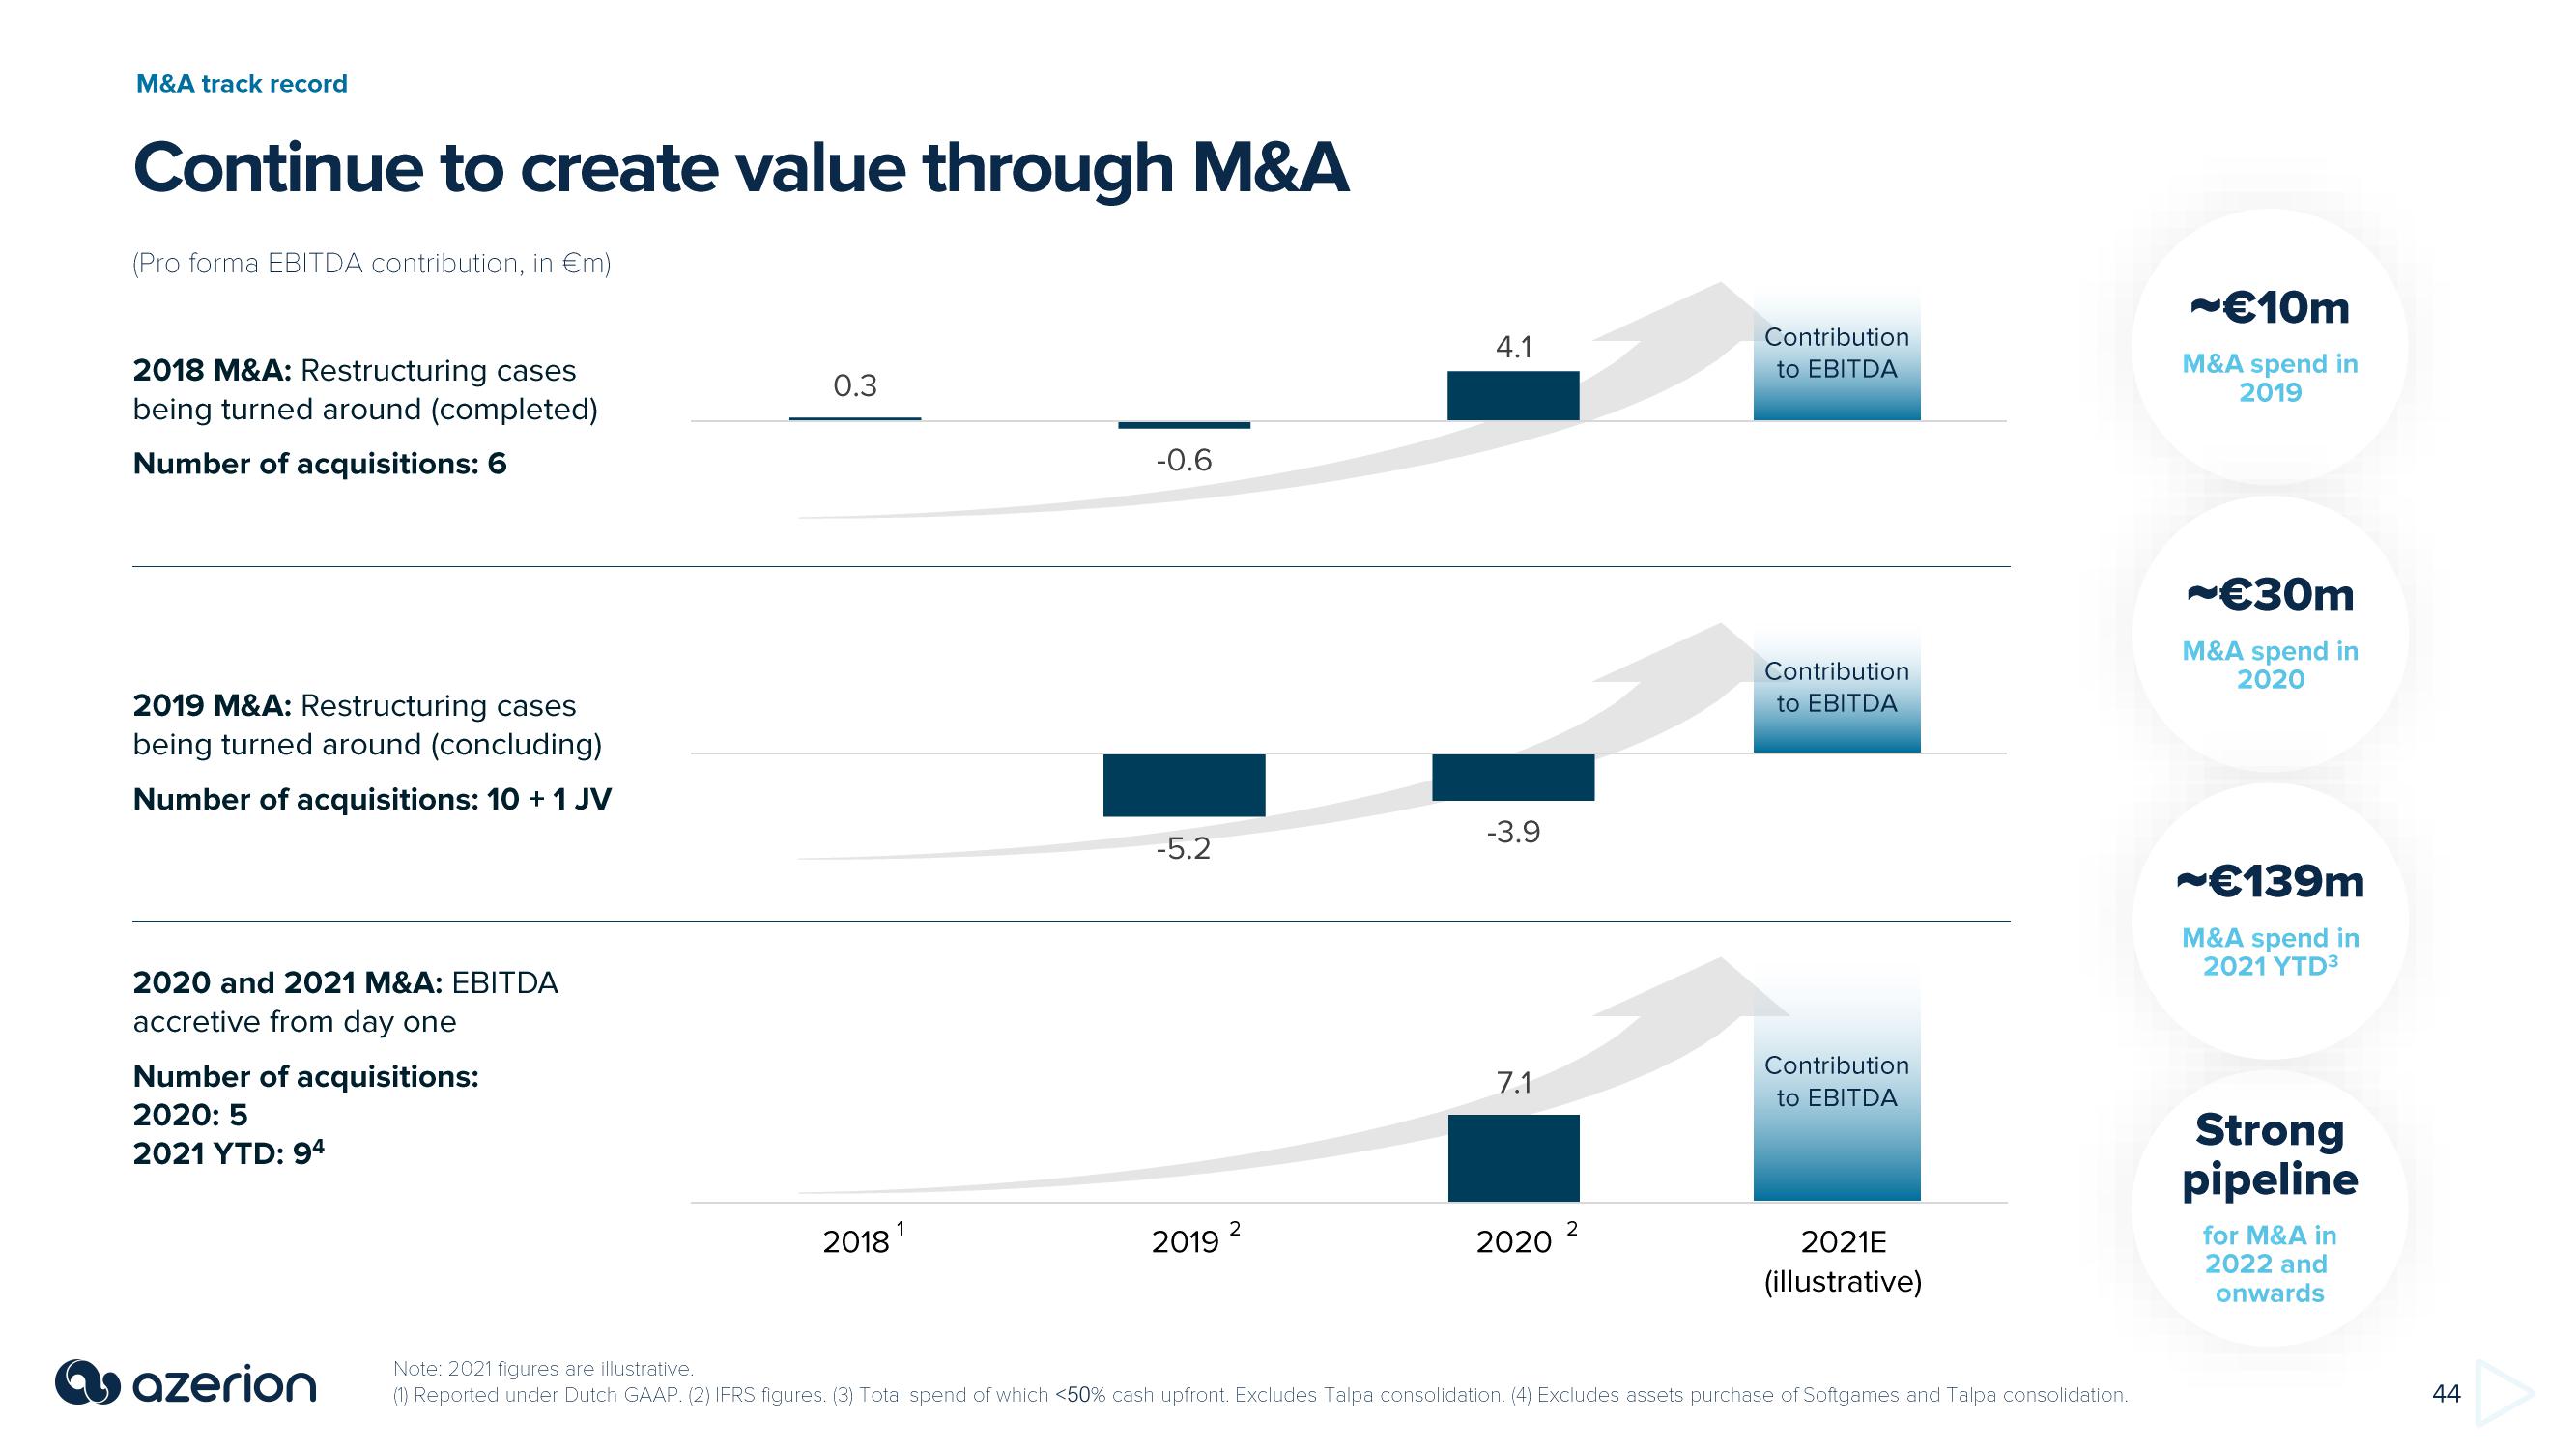
Continue to create value through M&A
(Pro forma EBITDA contribution, in €m)
2018 M&A: Restructuring cases
being turned around (completed)
Number of acquisitions: 6
2019 M&A: Restructuring cases
being turned around (concluding)
Number of acquisitions: 10 + 1 JV
2020 and 2021 M&A: EBITDA
accretive from day one
Number of acquisitions:
2020: 5
2021 YTD: 94
azerion
0.3
1
2018 ¹
-0.6
-5.2
2019
2
4.1
-3.9
7.1
2020
2
Contribution
to EBITDA
Contribution
to EBITDA
Contribution
to EBITDA
2021E
(illustrative)
Note: 2021 figures are illustrative.
(1) Reported under Dutch GAAP. (2) IFRS figures. (3) Total spend of which <50% cash upfront. Excludes Talpa consolidation. (4) Excludes assets purchase of Softgames and Talpa consolidation.
~€10m
M&A spend in
2019
~€30m
M&A spend in
2020
~€139m
M&A spend in
2021 YTD³
Strong
pipeline
for M&A in
2022 and
onwards
44View entire presentation