Evotec Results Presentation Deck
evotec
Balance sheet total
in € m
1,462.9
(1.5).
PAGE 16
Strong balance sheet supporting accelerated growth
Balance sheet and liquidity – 31 Dec. 2020 vs. 30 June 2021¹) – Evotec SE and subsidiaries
Net Debt ratio (excl. IFRS 16)
x adjusted EBITDA²)
Equity Ratio
in %
1,621.1 49.4
49.4...
Liquidity position
in € m
(1.0) 481.9
¹) Differences may occur due to rounding
2) Versus 31 Dec 2020; incl. IFRS16 0,1 (31 Dec 2020) vs 0,7 (30 June 2021)
52.6
449.3
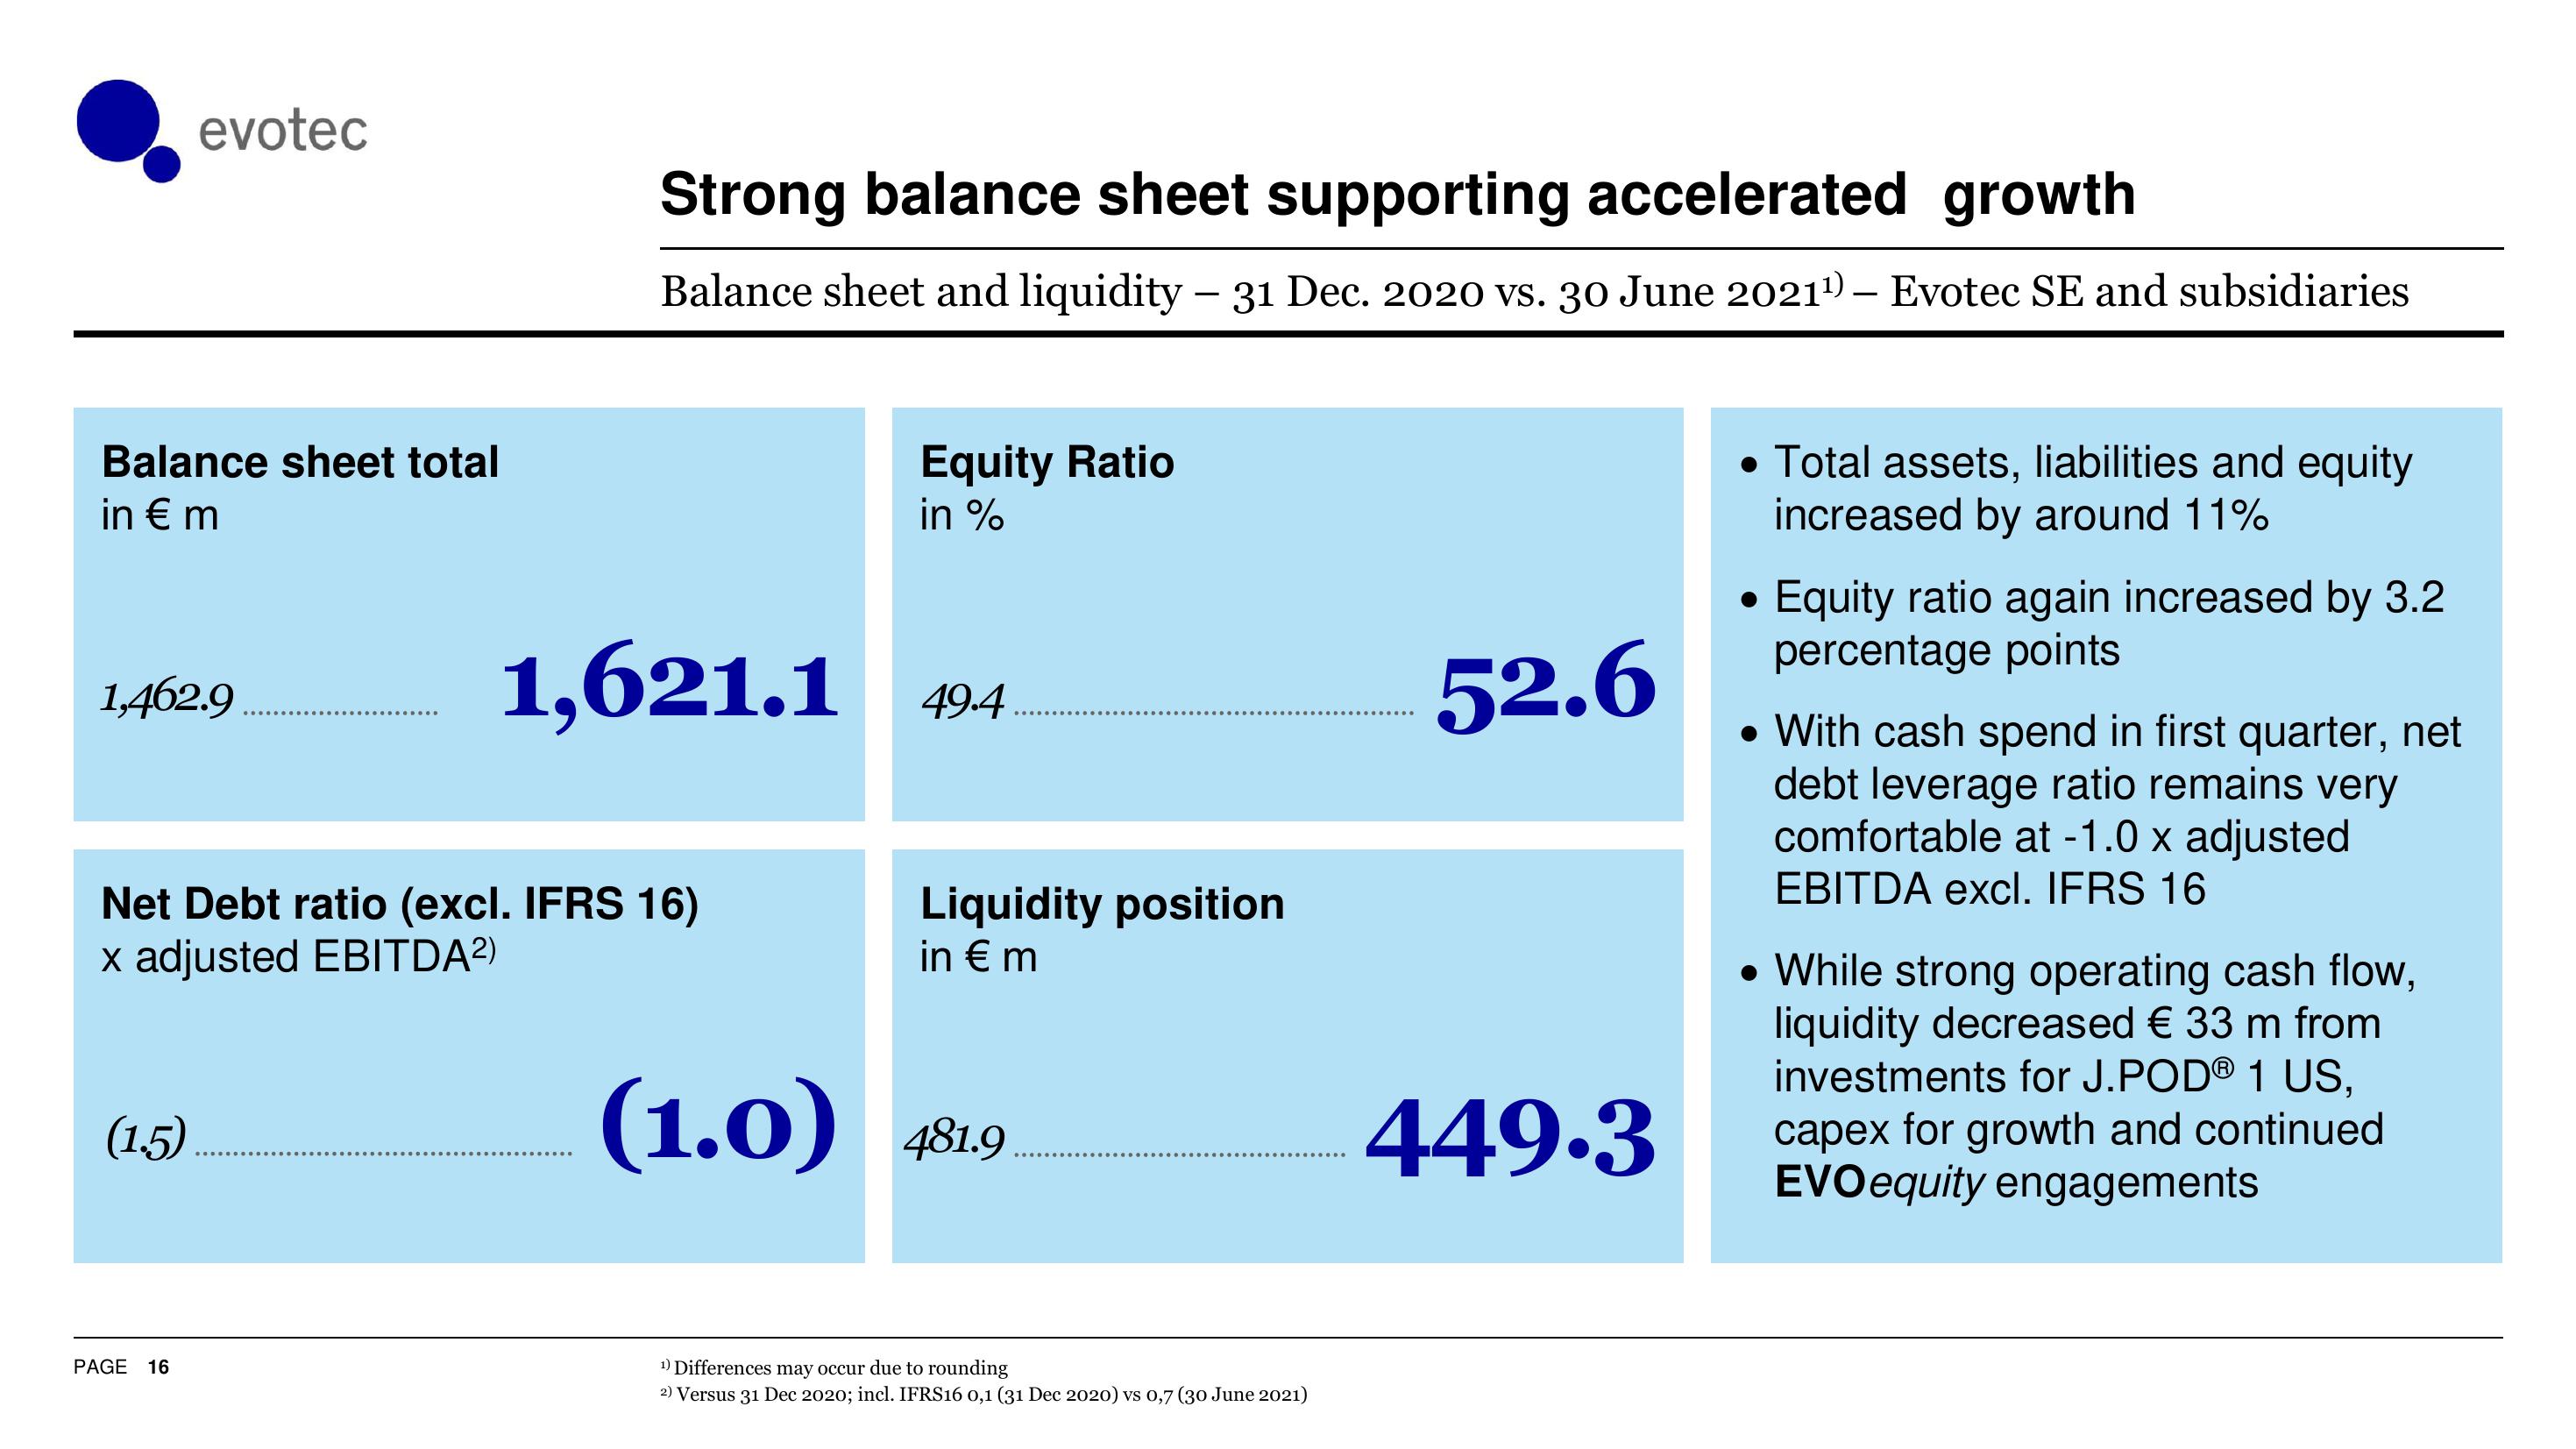
• Total assets, liabilities and equity
increased by around 11%
Equity ratio again increased by 3.2
percentage points
With cash spend in first quarter, net
debt leverage ratio remains very
comfortable at -1.0 x adjusted
EBITDA excl. IFRS 16
• While strong operating cash flow,
liquidity decreased € 33 m from
investments for J.POD® 1 US,
capex for growth and continued
EVO equity engagementsView entire presentation