Granite Ridge Investor Presentation Deck
Overview
Yield %
Strategy & Execution
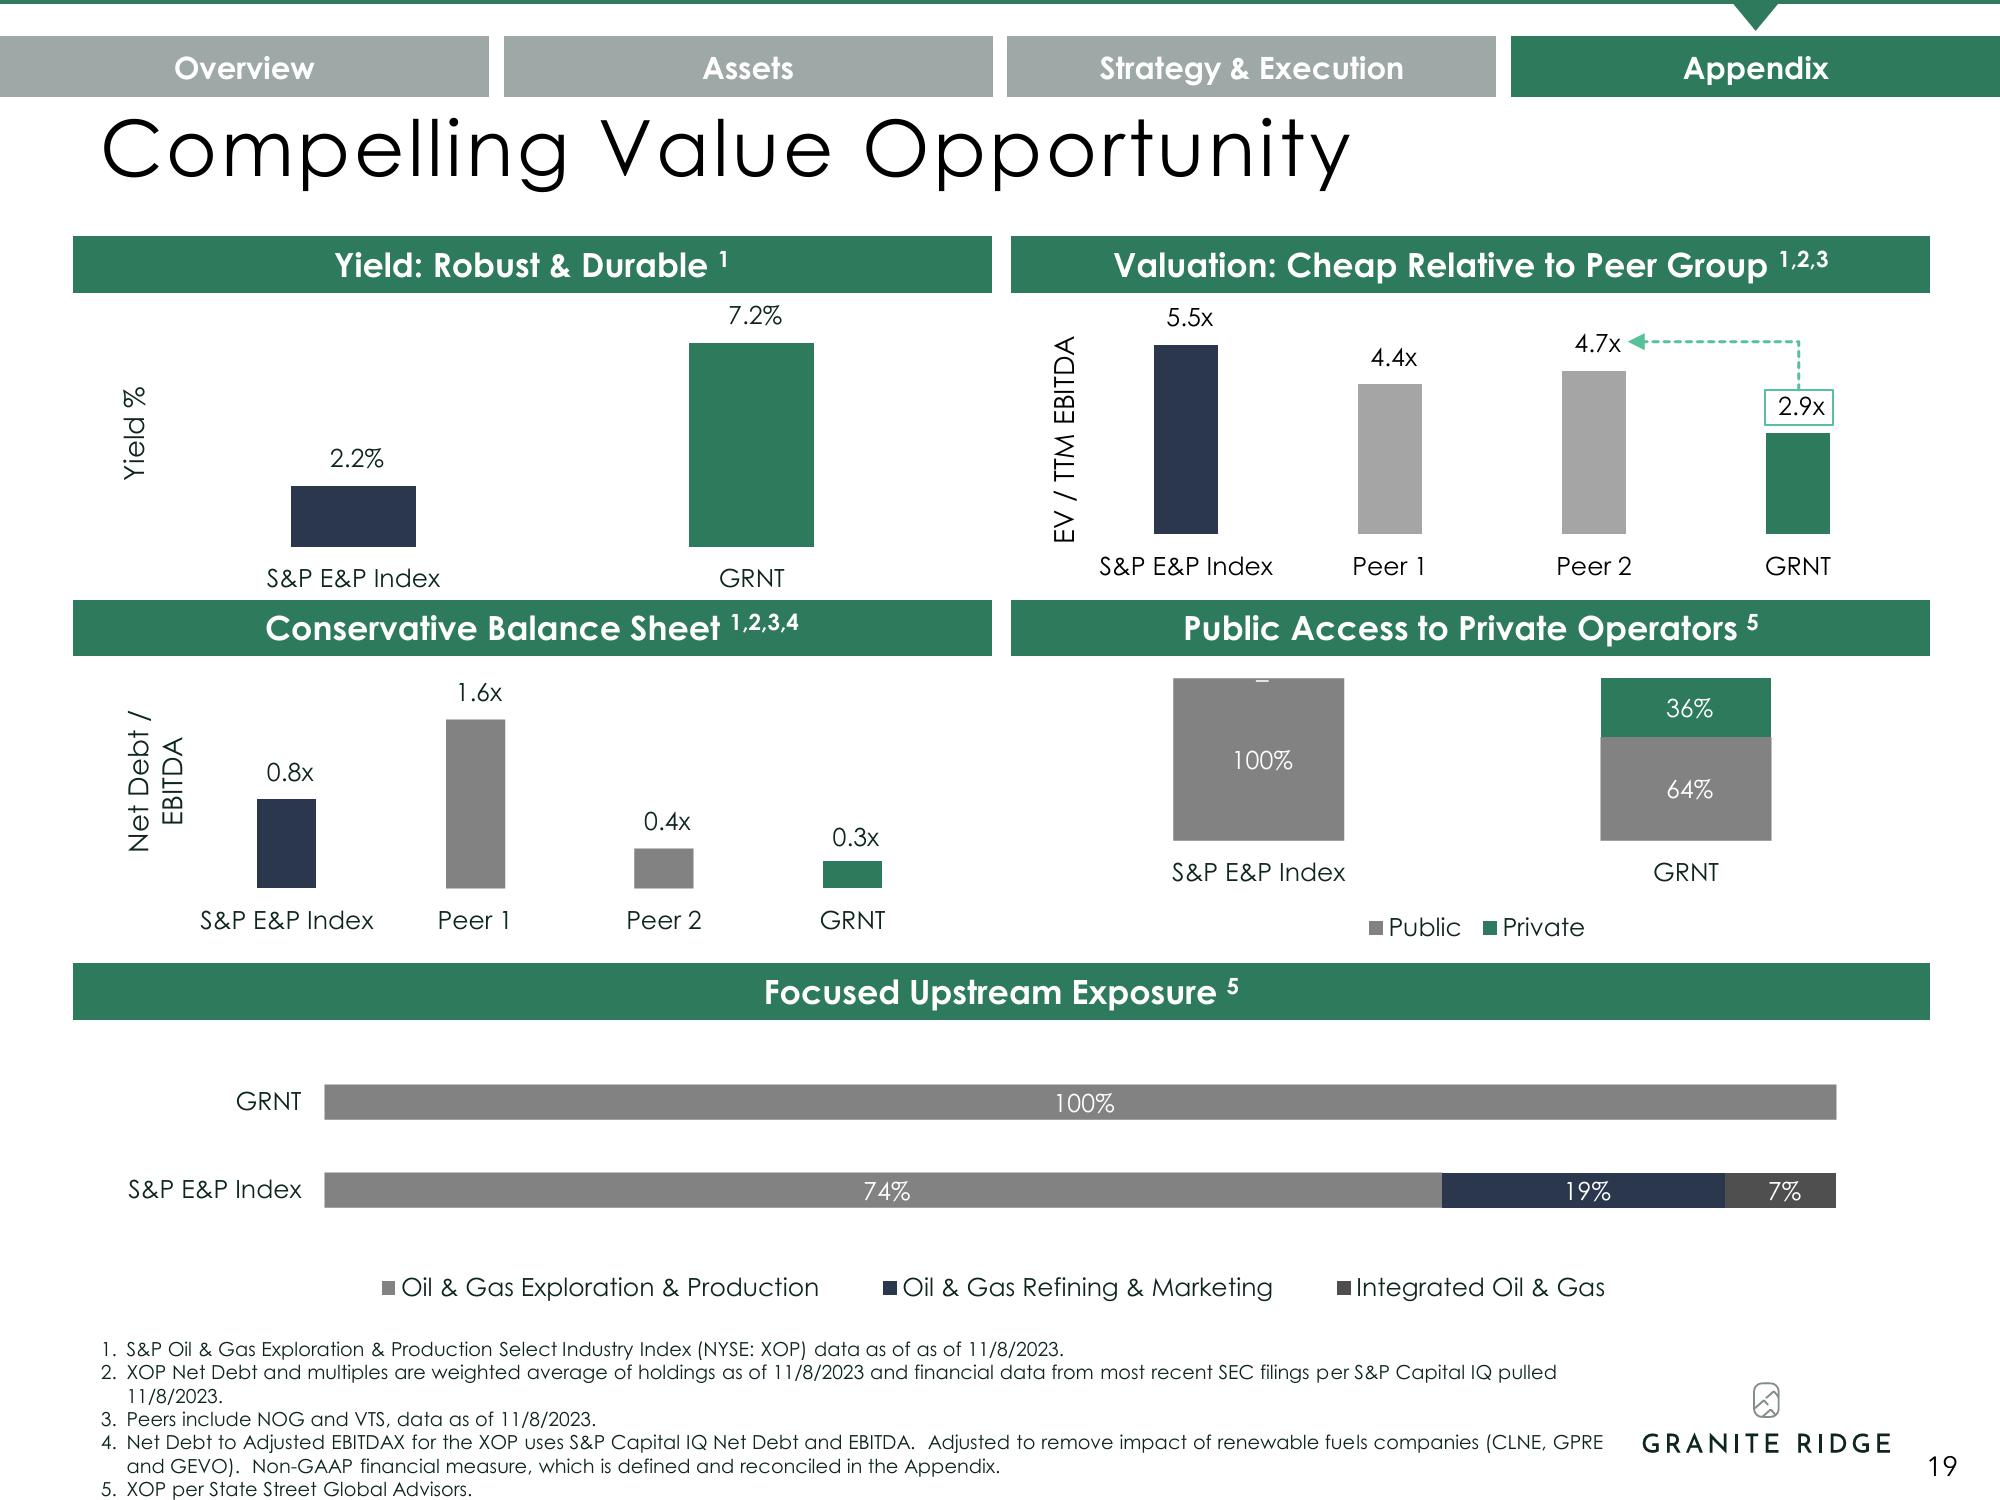
Compelling Value Opportunity
Net Debt /
EBITDA
0.8x
GRNT
Yield: Robust & Durable ¹
2.2%
S&P E&P Index
GRNT
Conservative Balance Sheet 1,2,3,4
S&P E&P Index
S&P E&P Index
1.6x
Assets
Peer 1
0.4x
Peer 2
7.2%
0.3x
■ Oil & Gas Exploration & Production
GRNT
EV / TTM EBITDA
74%
Valuation: Cheap Relative to Peer Group 1,2,3
5.5x
S&P E&P Index
Focused Upstream Exposure
100%
100%
S&P E&P Index
4.4x
Oil & Gas Refining & Marketing
Peer 1
Public Access to Private Operators
4.7x
Peer 2
Public Private
1. S&P Oil & Gas Exploration & Production Select Industry Index (NYSE: XOP) data as of as of 11/8/2023.
2. XOP Net Debt and multiples are weighted average of holdings as of 11/8/2023 and financial data from most recent SEC filings per S&P Capital IQ pulled
11/8/2023.
Appendix
19%
Integrated Oil & Gas
36%
64%
GRNT
5
2.9x
GRNT
7%
@
3. Peers include NOG and VTS, data as of 11/8/2023.
4. Net Debt to Adjusted EBITDAX for the XOP uses S&P Capital IQ Net Debt and EBITDA. Adjusted to remove impact of renewable fuels companies (CLNE, GPRE GRANITE RIDGE
and GEVO). Non-GAAP financial measure, which is defined and reconciled in the Appendix.
5. XOP per State Street Global Advisors.
19View entire presentation