Apollo Global Management Investor Day Presentation Deck
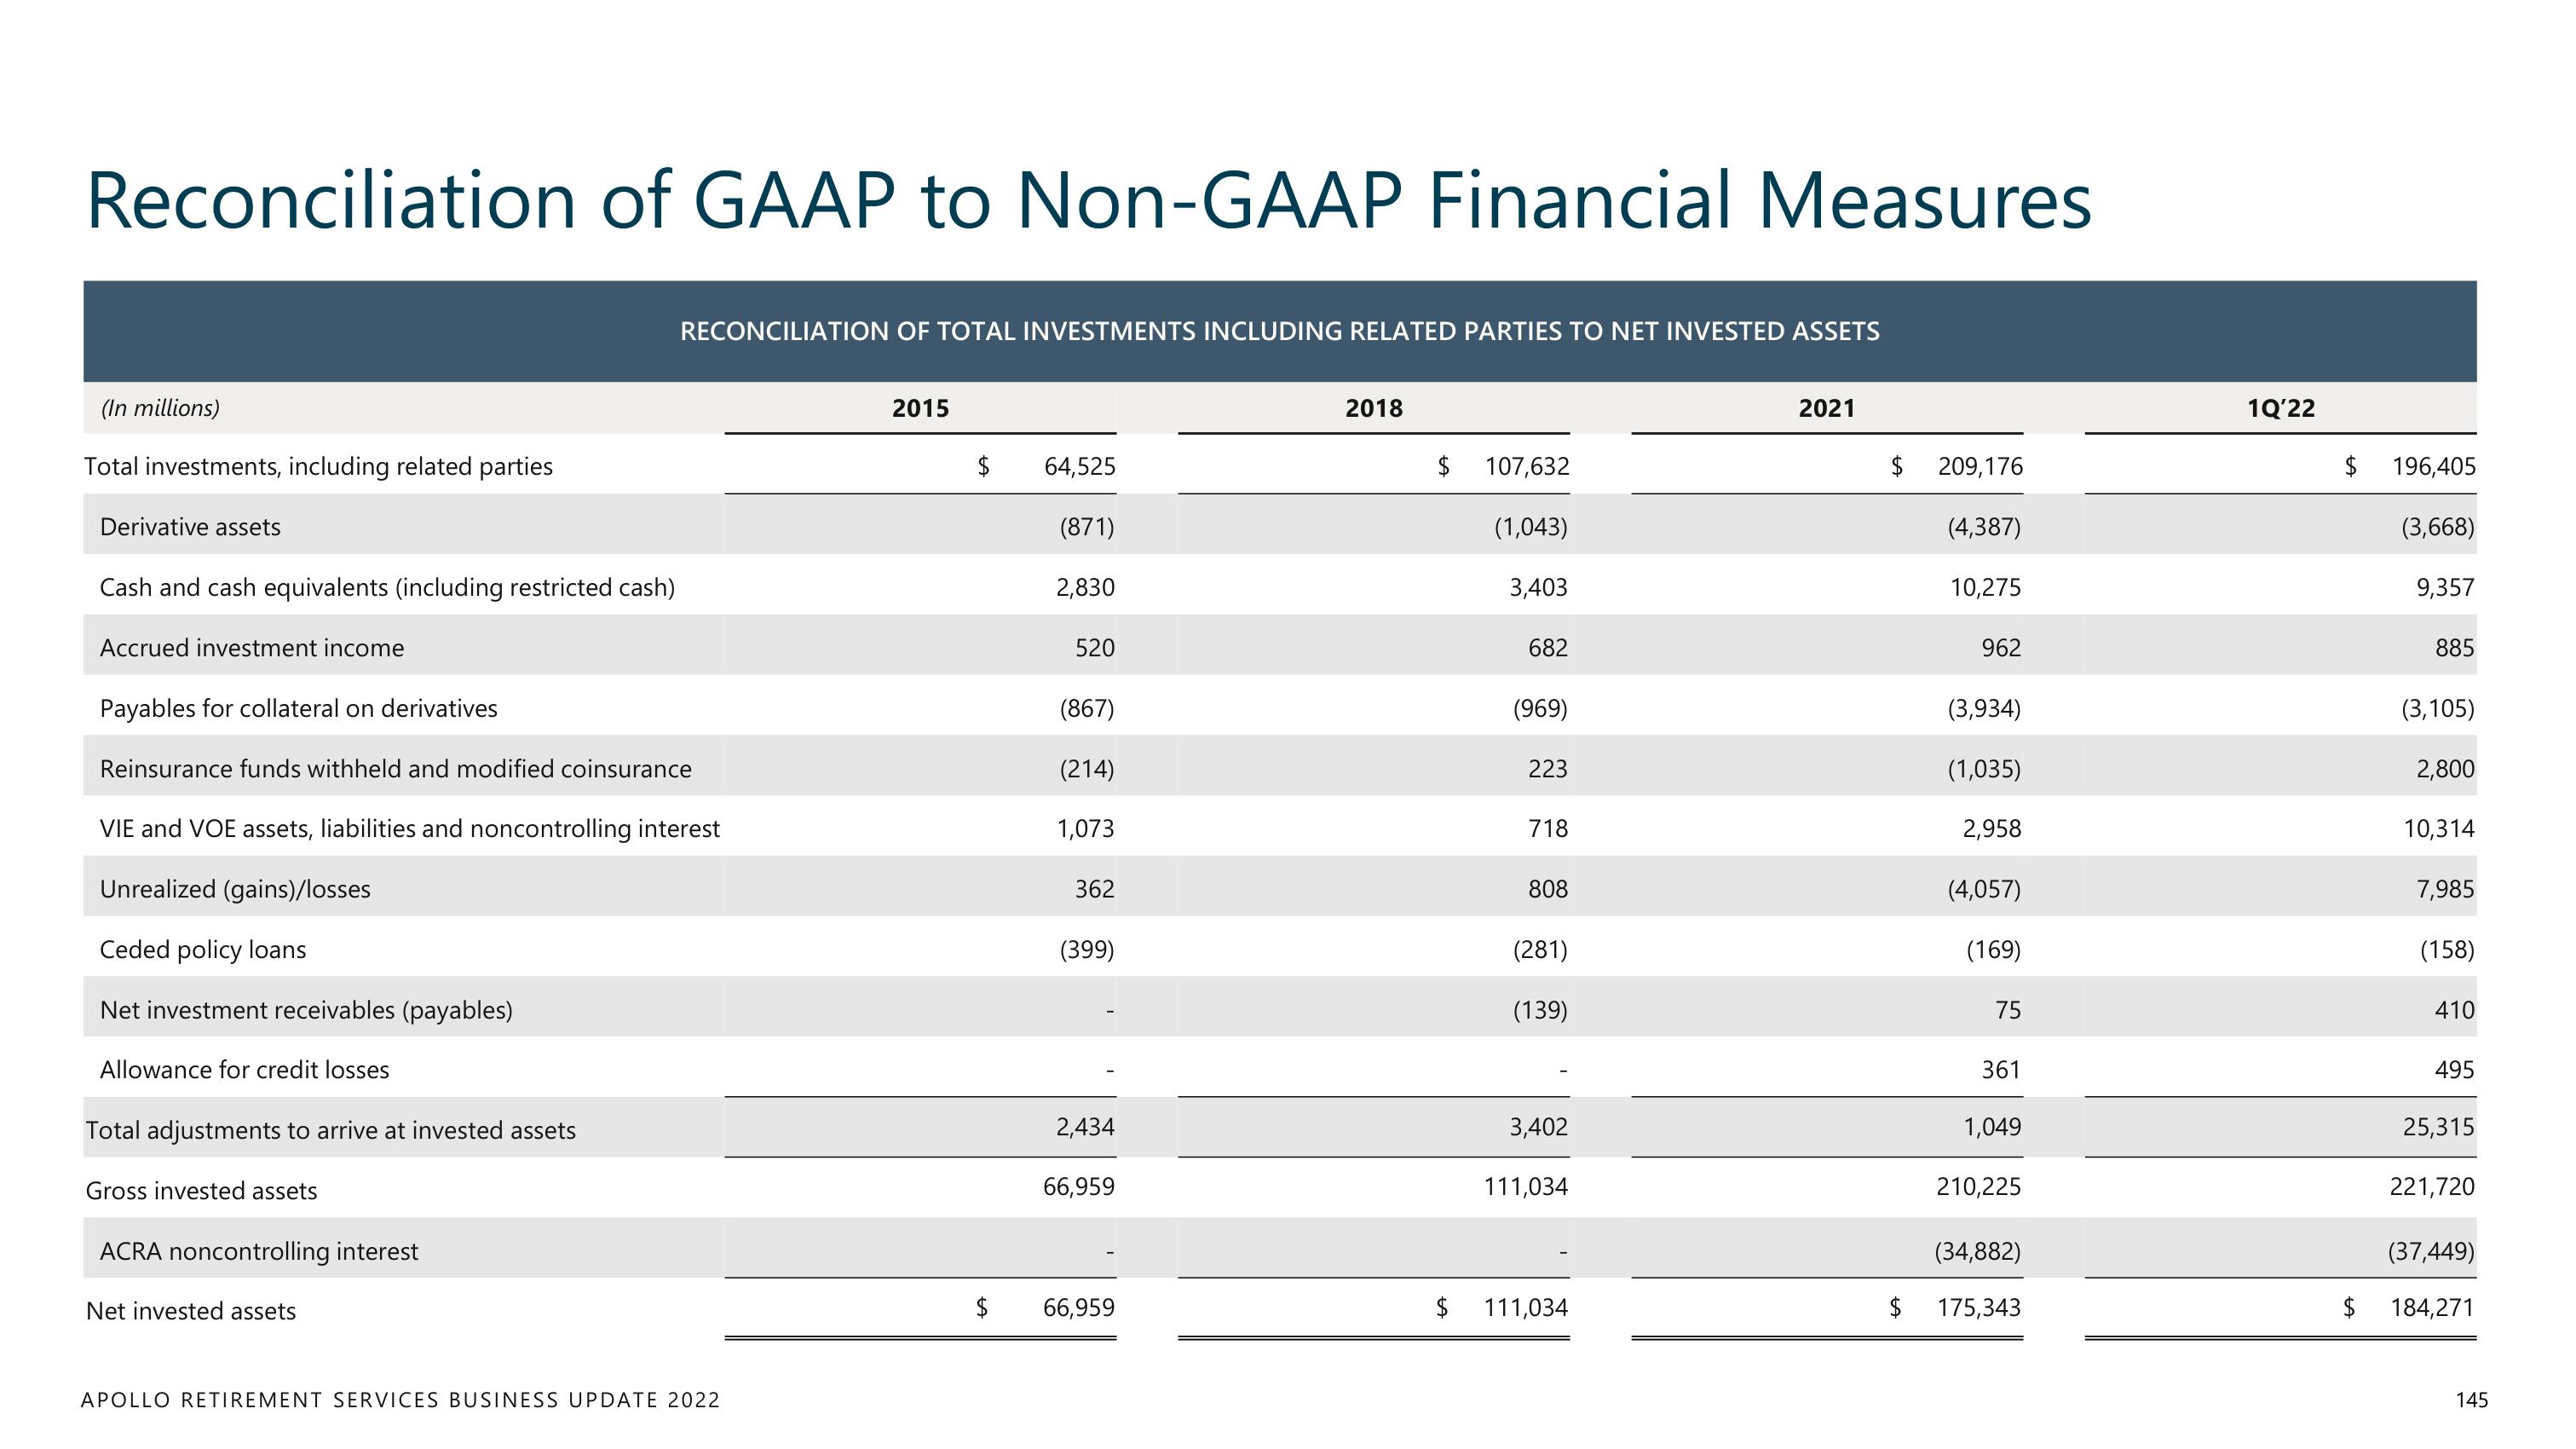
Reconciliation of GAAP to Non-GAAP Financial Measures
(In millions)
Total investments, including related parties
Derivative assets
Cash and cash equivalents (including restricted cash)
Accrued investment income
Payables for collateral on derivatives
Reinsurance funds withheld and modified coinsurance
VIE and VOE assets, liabilities and noncontrolling interest
Unrealized (gains)/losses
Ceded policy loans
Net investment receivables (payables)
Allowance for credit losses
Total adjustments to arrive at invested assets
Gross invested assets
RECONCILIATION OF TOTAL INVESTMENTS INCLUDING RELATED PARTIES TO NET INVESTED ASSETS
ACRA noncontrolling interest
Net invested assets
APOLLO RETIREMENT SERVICES BUSINESS UPDATE 2022
2015
$
$
64,525
(871)
2,830
520
(867)
(214)
1,073
362
(399)
2,434
66,959
66,959
2018
$ 107,632
(1,043)
3,403
682
(969)
223
718
808
(281)
(139)
3,402
111,034
$ 111,034
2021
$
$
209,176
(4,387)
10,275
962
(3,934)
(1,035)
2,958
(4,057)
(169)
75
361
1,049
210,225
(34,882)
175,343
1Q'22
$ 196,405
(3,668)
9,357
$
885
(3,105)
2,800
10,314
7,985
(158)
410
495
25,315
221,720
(37,449)
184,271
145View entire presentation