Affirm Results Presentation Deck
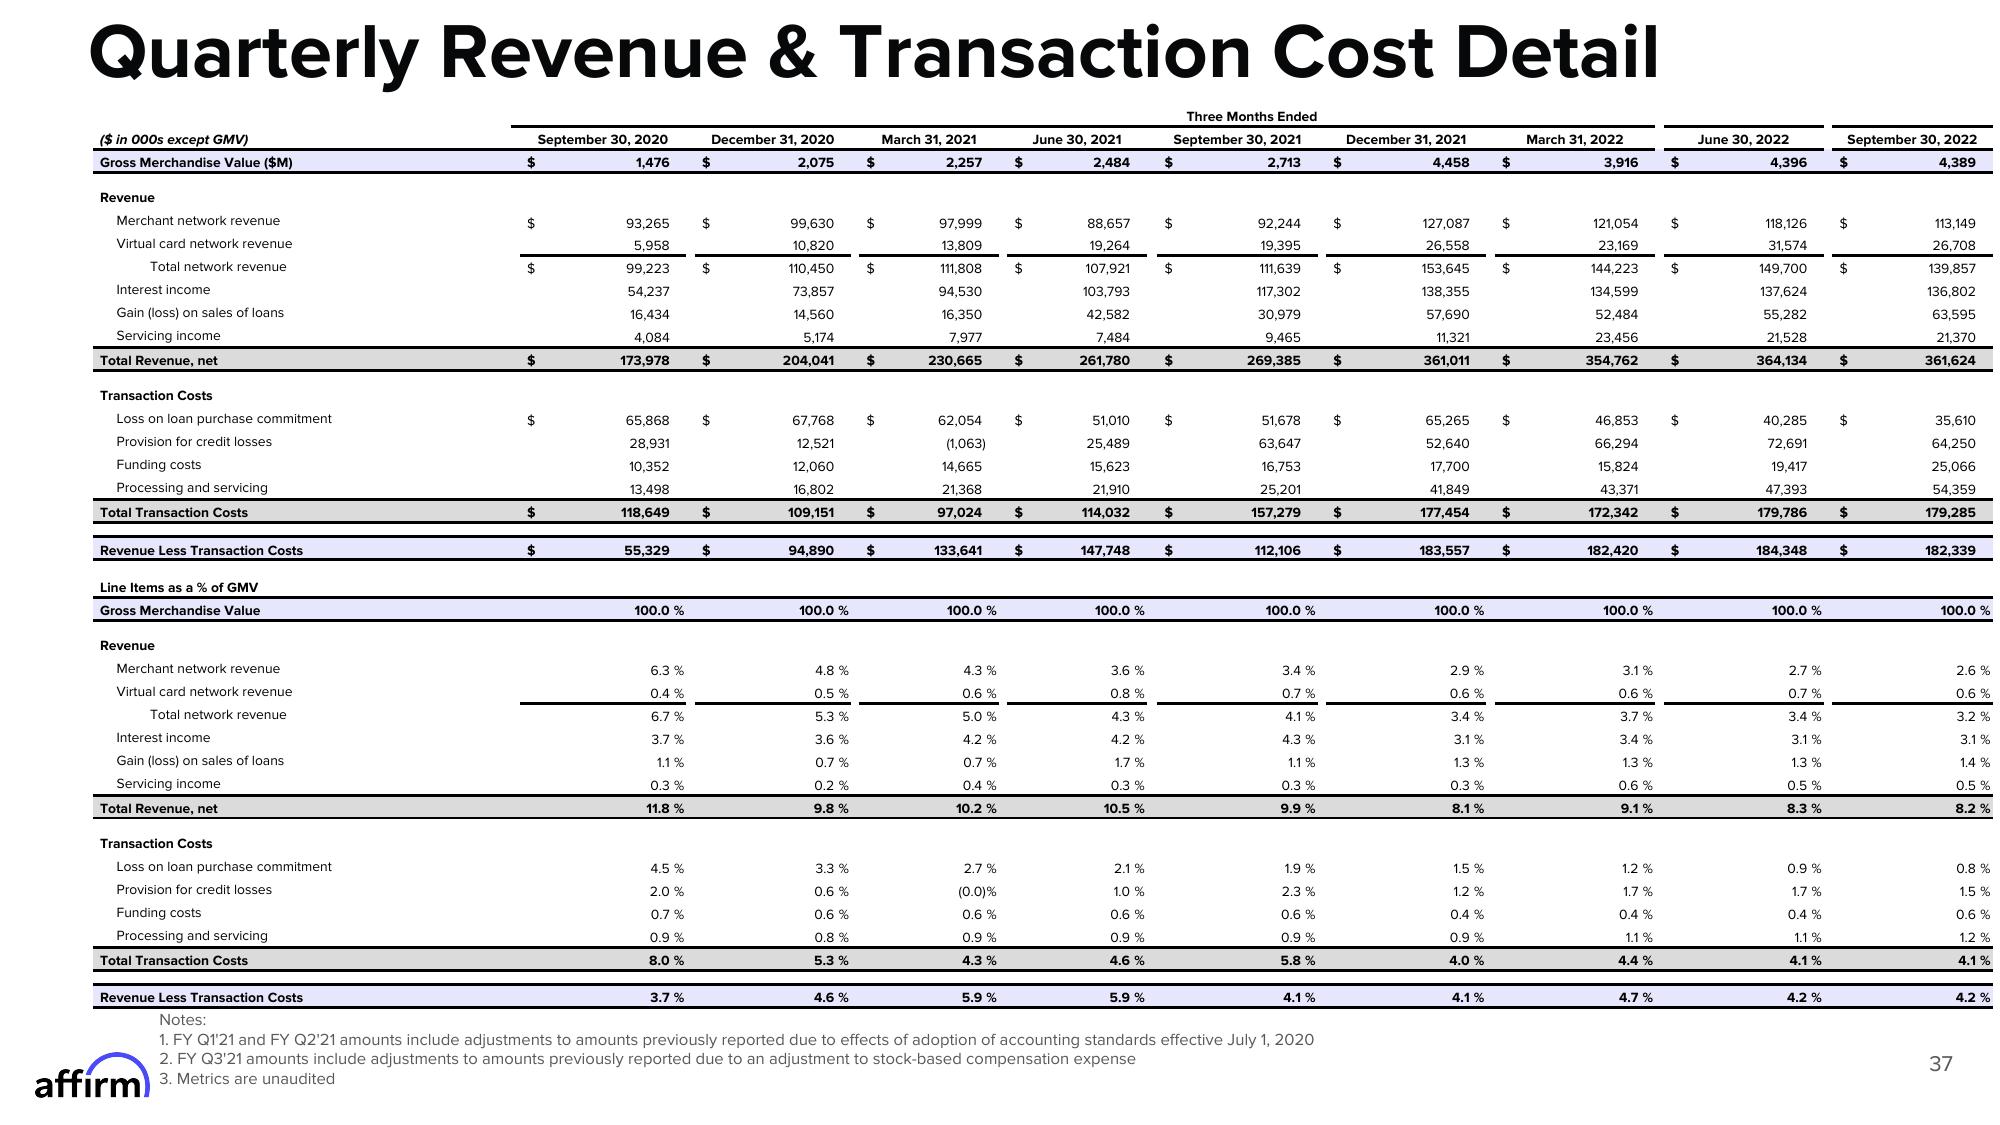
Quarterly Revenue & Transaction Cost Detail
December 31, 2020
2,075
($ in 000s except GMV)
Gross Merchandise Value ($M)
Revenue
Merchant network revenue
Virtual card network revenue
Total network revenue
Interest income
Gain (loss) on sales of loans
Servicing income
Total Revenue, net
Transaction Costs
Loss on loan purchase commitment
Provision for credit losses
Funding costs
Processing and servicing
Total Transaction Costs
Revenue Less Transaction Costs
Line Items as a % of GMV
Gross Merchandise Value
Revenue
Merchant network revenue
Virtual card network revenue
Total network revenue
Interest income
Gain (loss) on sales of loans
Servicing income
Total Revenue, net
Transaction Costs
Loss on loan purchase commitment
Provision for credit losses.
Funding costs
Processing and servicing
Total Transaction Costs
$
affirm) 3. Metrics are unaudited
$
$
$
$
$
$
September 30, 2020
1,476
93,265
5,958
99,223
54,237
16,434
4,084
173,978
65,868
28,931
10,352
13,498
118,649
100.0 %
6.3 %
0.4 %
6.7 %
3.7%
1.1%
0.3%
11.8%
4.5 %
2.0%
0.7%
0.9 %
8.0 %
$
3.7 %
$
55,329 $
$
$
$
$
99,630
10,820
110,450
73,857
14,560
5,174
204,041
67,768
12,521
12,060
16,802
109,151
94,890
100.0 %
4.8 %
0.5%
5.3%
3.6 %
0.7%
0.2 %
9.8 %
3.3 %
0.6 %
0.6 %
0.8%
5.3%
4.6 %
$
$
$
$
$
$
$
March 31, 2021
2,257
97,999
13,809
111,808
94,530
16,350
7,977
230,665
100.0 %
4.3 %
0.6 %
5.0 %
4.2 %
0.7%
0.4 %
10.2 %
62,054 $
(1,063)
14,665
21,368
97,024 $
2.7%
(0.0)%
0.6 %
$
133,641 $
0.9 %
4.3 %
$
5.9 %
$
$
June 30, 2021
2,484
88,657
19,264
107,921
103,793
42,582
7,484
261,780
51,010
25,489
15,623
21.910
114,032
147,748
100.0 %
3.6 %
0.8 %
4.3 %
4.2 %
1.7 %
0.3%
10.5 %
2.1%
1.0 %
0.6 %
0.9 %
4.6 %
5.9 %
Three Months Ended
September 30, 2021
2,713
$
$
$
$
$
$
$
92,244
19,395
111,639
117,302
30,979
9,465
269,385
51,678
63,647
16,753
25,201
157,279
Revenue Less Transaction Costs
Notes:
1. FY Q1'21 and FY Q2'21 amounts include adjustments to amounts previously reported due to effects of adoption of accounting standards effective July 1, 2020
2. FY Q3'21 amounts include adjustments to amounts previously reported due to an adjustment to stock-based compensation expense
112,106
100.0 %
3.4 %
0.7 %
4.1%
4.3 %
1.1 %
0.3%
9.9 %
1.9 %
2.3 %
0.6 %
0.9 %
5.8 %
4.1 %
$
$
$
$
$
$
$
December 31, 2021
4,458
127,087
26,558
153,645
138,355
57,690
11,321
361,011
65,265
52,640
17,700
41,849
177,454
183,557
100.0 %
2.9 %
0.6 %
3.4 %
3.1 %
1.3 %
0.3%
8.1%
1.5%
1.2 %
0.4 %
0.9 %
4.0 %
4.1%
$
$
$
$
$
$
$
March 31, 2022
3,916
121,054
23,169
144,223
134,599
52,484
23,456
354,762
46,853
66,294
15,824
43,371
172,342
182,420
100.0 %
3.1 %
0.6 %
3.7%
3.4 %
1.3%
0.6 %
9.1%
1.2 %
1.7 %
0.4 %
1.1 %
4.4%
4.7 %
$
$
$
$
$
$
$
June 30, 2022
4,396
118,126
31,574
149,700
137,624
55,282
21,528
364,134
184,348
100.0 %
2.7%
0.7%
3.4 %
3.1%
1.3 %
0.5 %
8.3 %
0.9 %
1.7%
0.4 %
40,285 $
72,691
19,417
47,393
179,786
1.1%
4.1 %
September 30, 2022
4,389
4.2 %
$
$
$
$
$
$
113,149
26,708
139,857
136,802
63,595
21,370
361,624
35,610
64,250
25,066
54,359
179,285
182,339
100.0 %
37
2.6 %
0.6 %
3.2 %
3.1%
1.4%
0.5 %
8.2 %
0.8 %
1.5 %
0.6 %
1.2 %
4.1%
4.2 %View entire presentation