Bird Investor Presentation Deck
Financial highlights
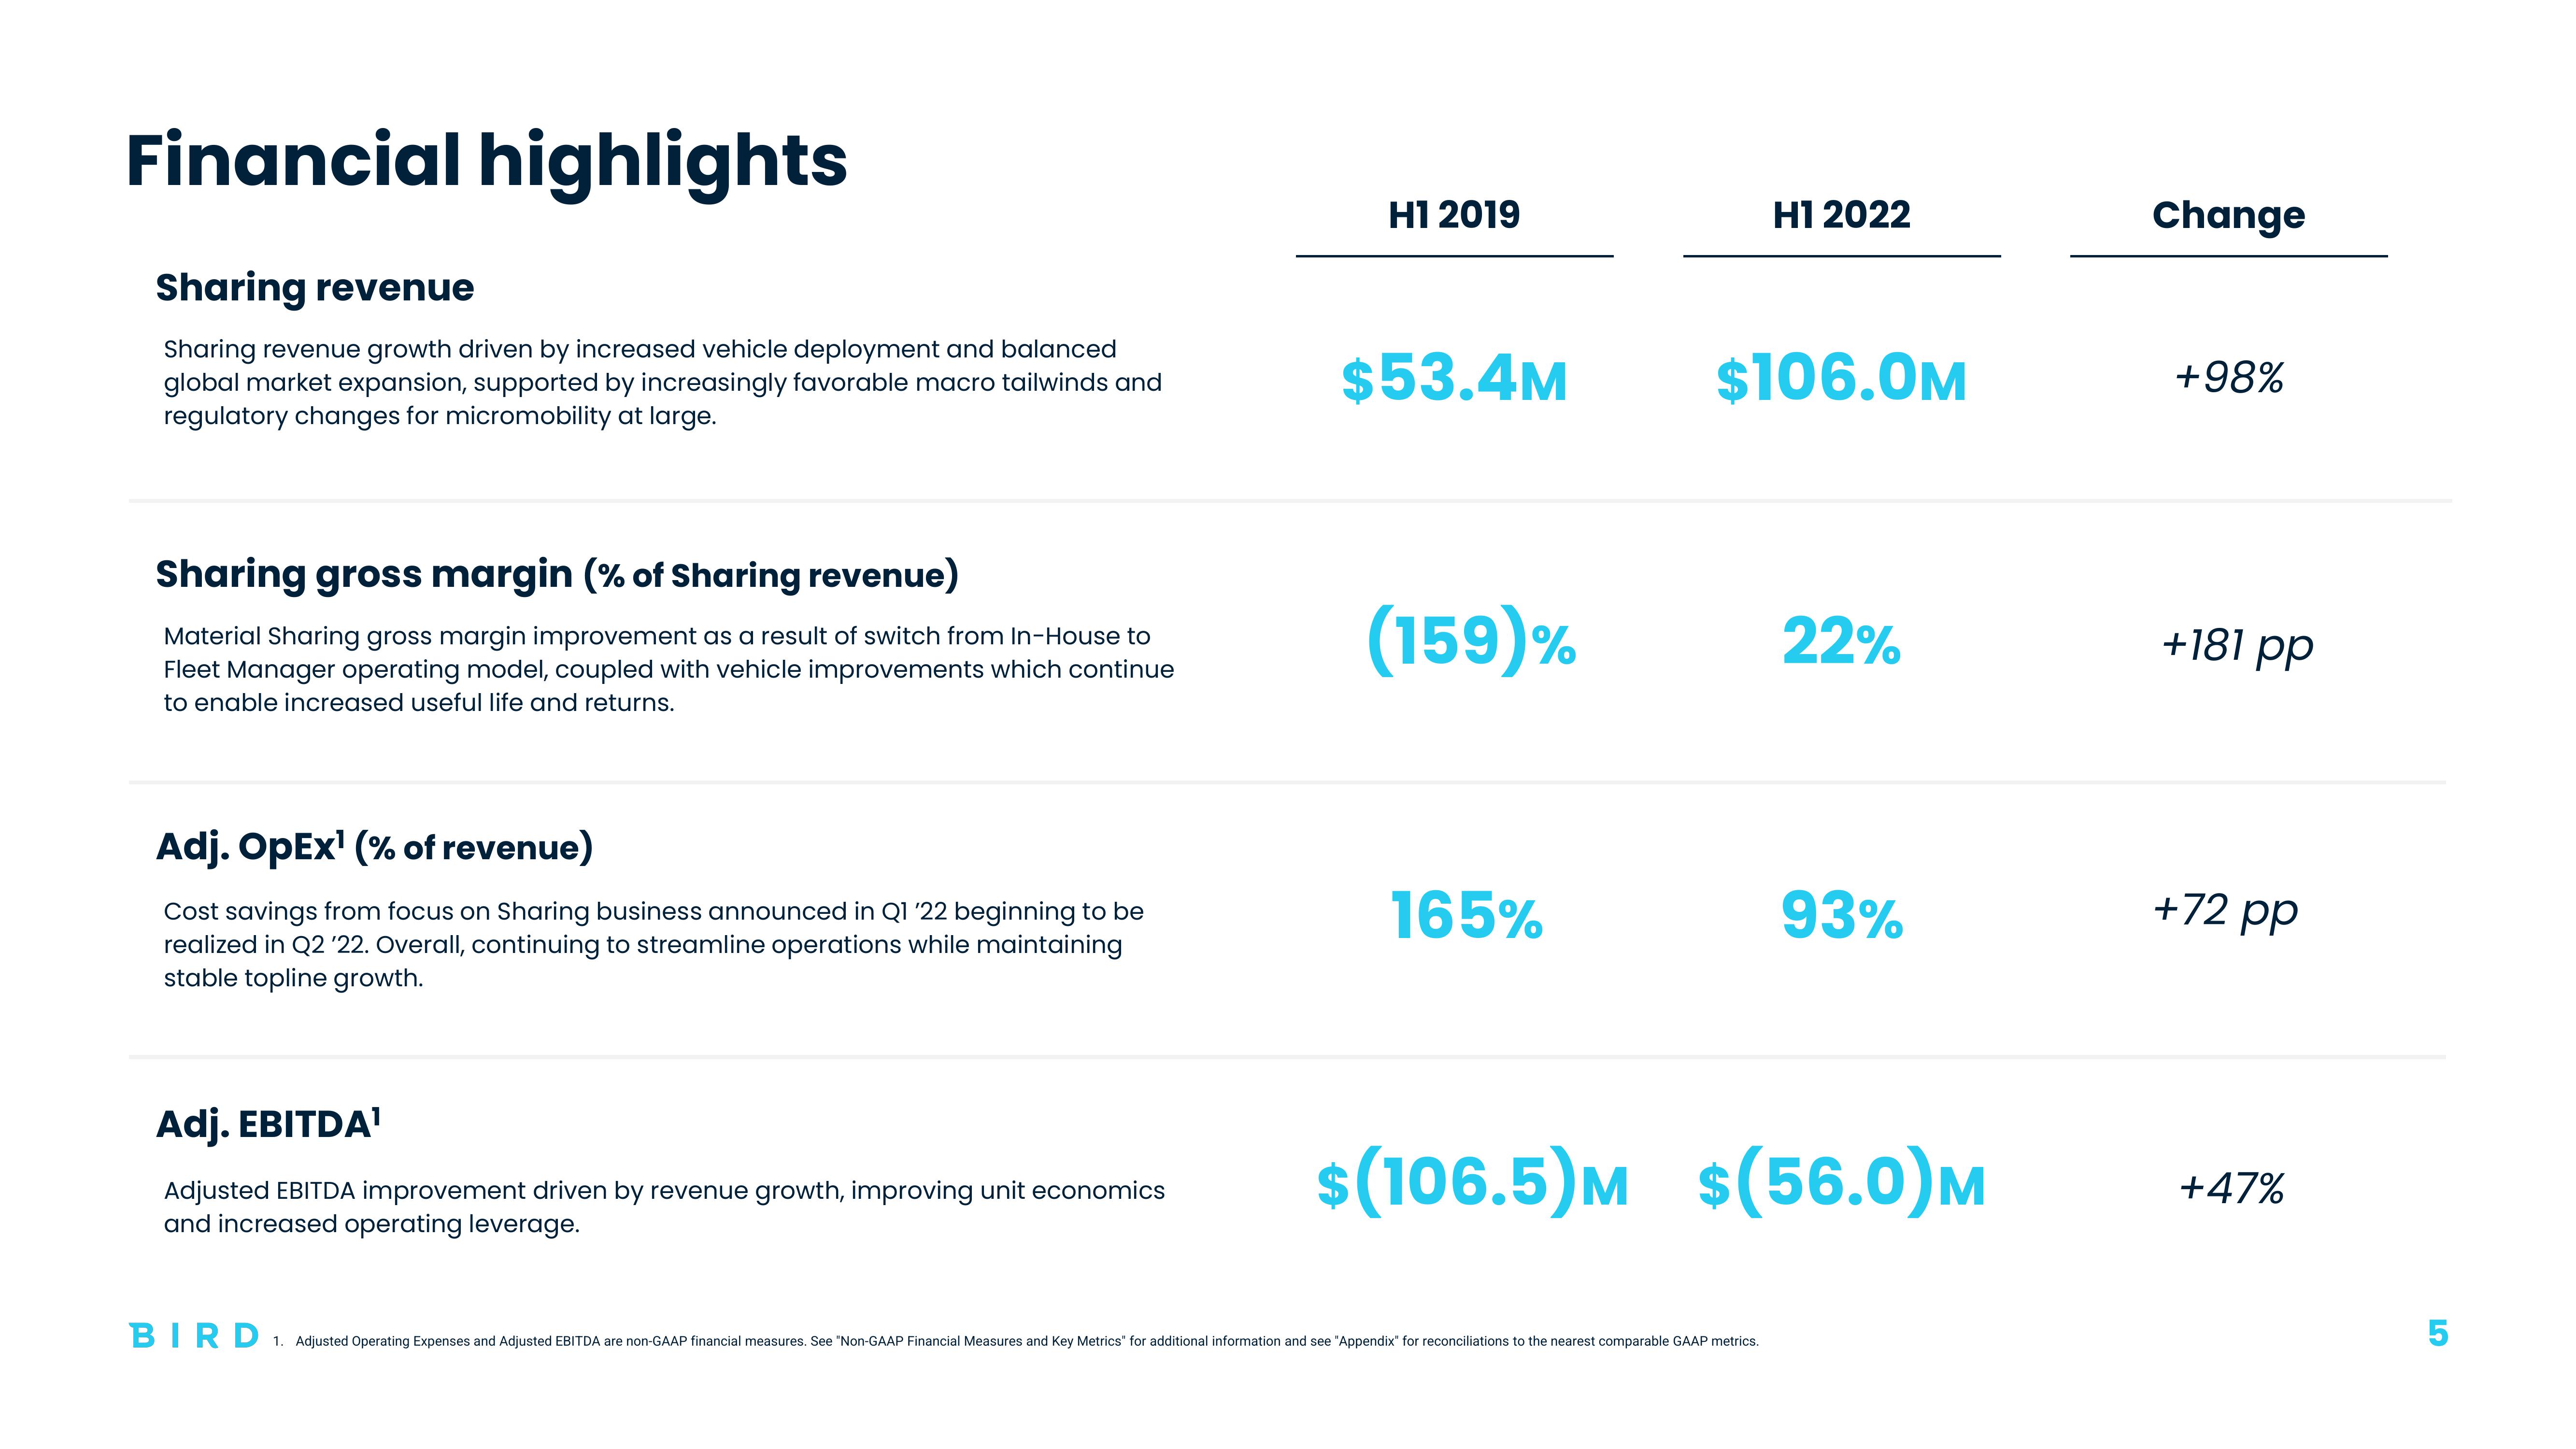
Sharing revenue
Sharing revenue growth driven by increased vehicle deployment and balanced
global market expansion, supported by increasingly favorable macro tailwinds and
regulatory changes for micromobility at large.
Sharing gross margin (% of Sharing revenue)
Material Sharing gross margin improvement as a result of switch from In-House to
Fleet Manager operating model, coupled with vehicle improvements which continue
to enable increased useful life and returns.
Adj. OpEx¹ (% of revenue)
Cost savings from focus on Sharing business announced in Q1 '22 beginning to be
realized in Q2 '22. Overall, continuing to streamline operations while maintaining
stable topline growth.
Adj. EBITDA¹
Adjusted EBITDA improvement driven by revenue growth, improving unit economics
and increased operating leverage.
H1 2019
$53.4M
(159)%
165%
H1 2022
$106.0M
BIRD 1. Adjusted Operating Expenses and Adjusted EBITDA are non-GAAP financial measures. See "Non-GAAP Financial Measures and Key Metrics" for additional information and see "Appendix" for reconciliations to the nearest comparable GAAP metrics.
22%
93%
$(106.5)M $(56.0)M
Change
+98%
+181 pp
+72 pp
+47%
19
5View entire presentation