AstraZeneca Results Presentation Deck
Total Revenue
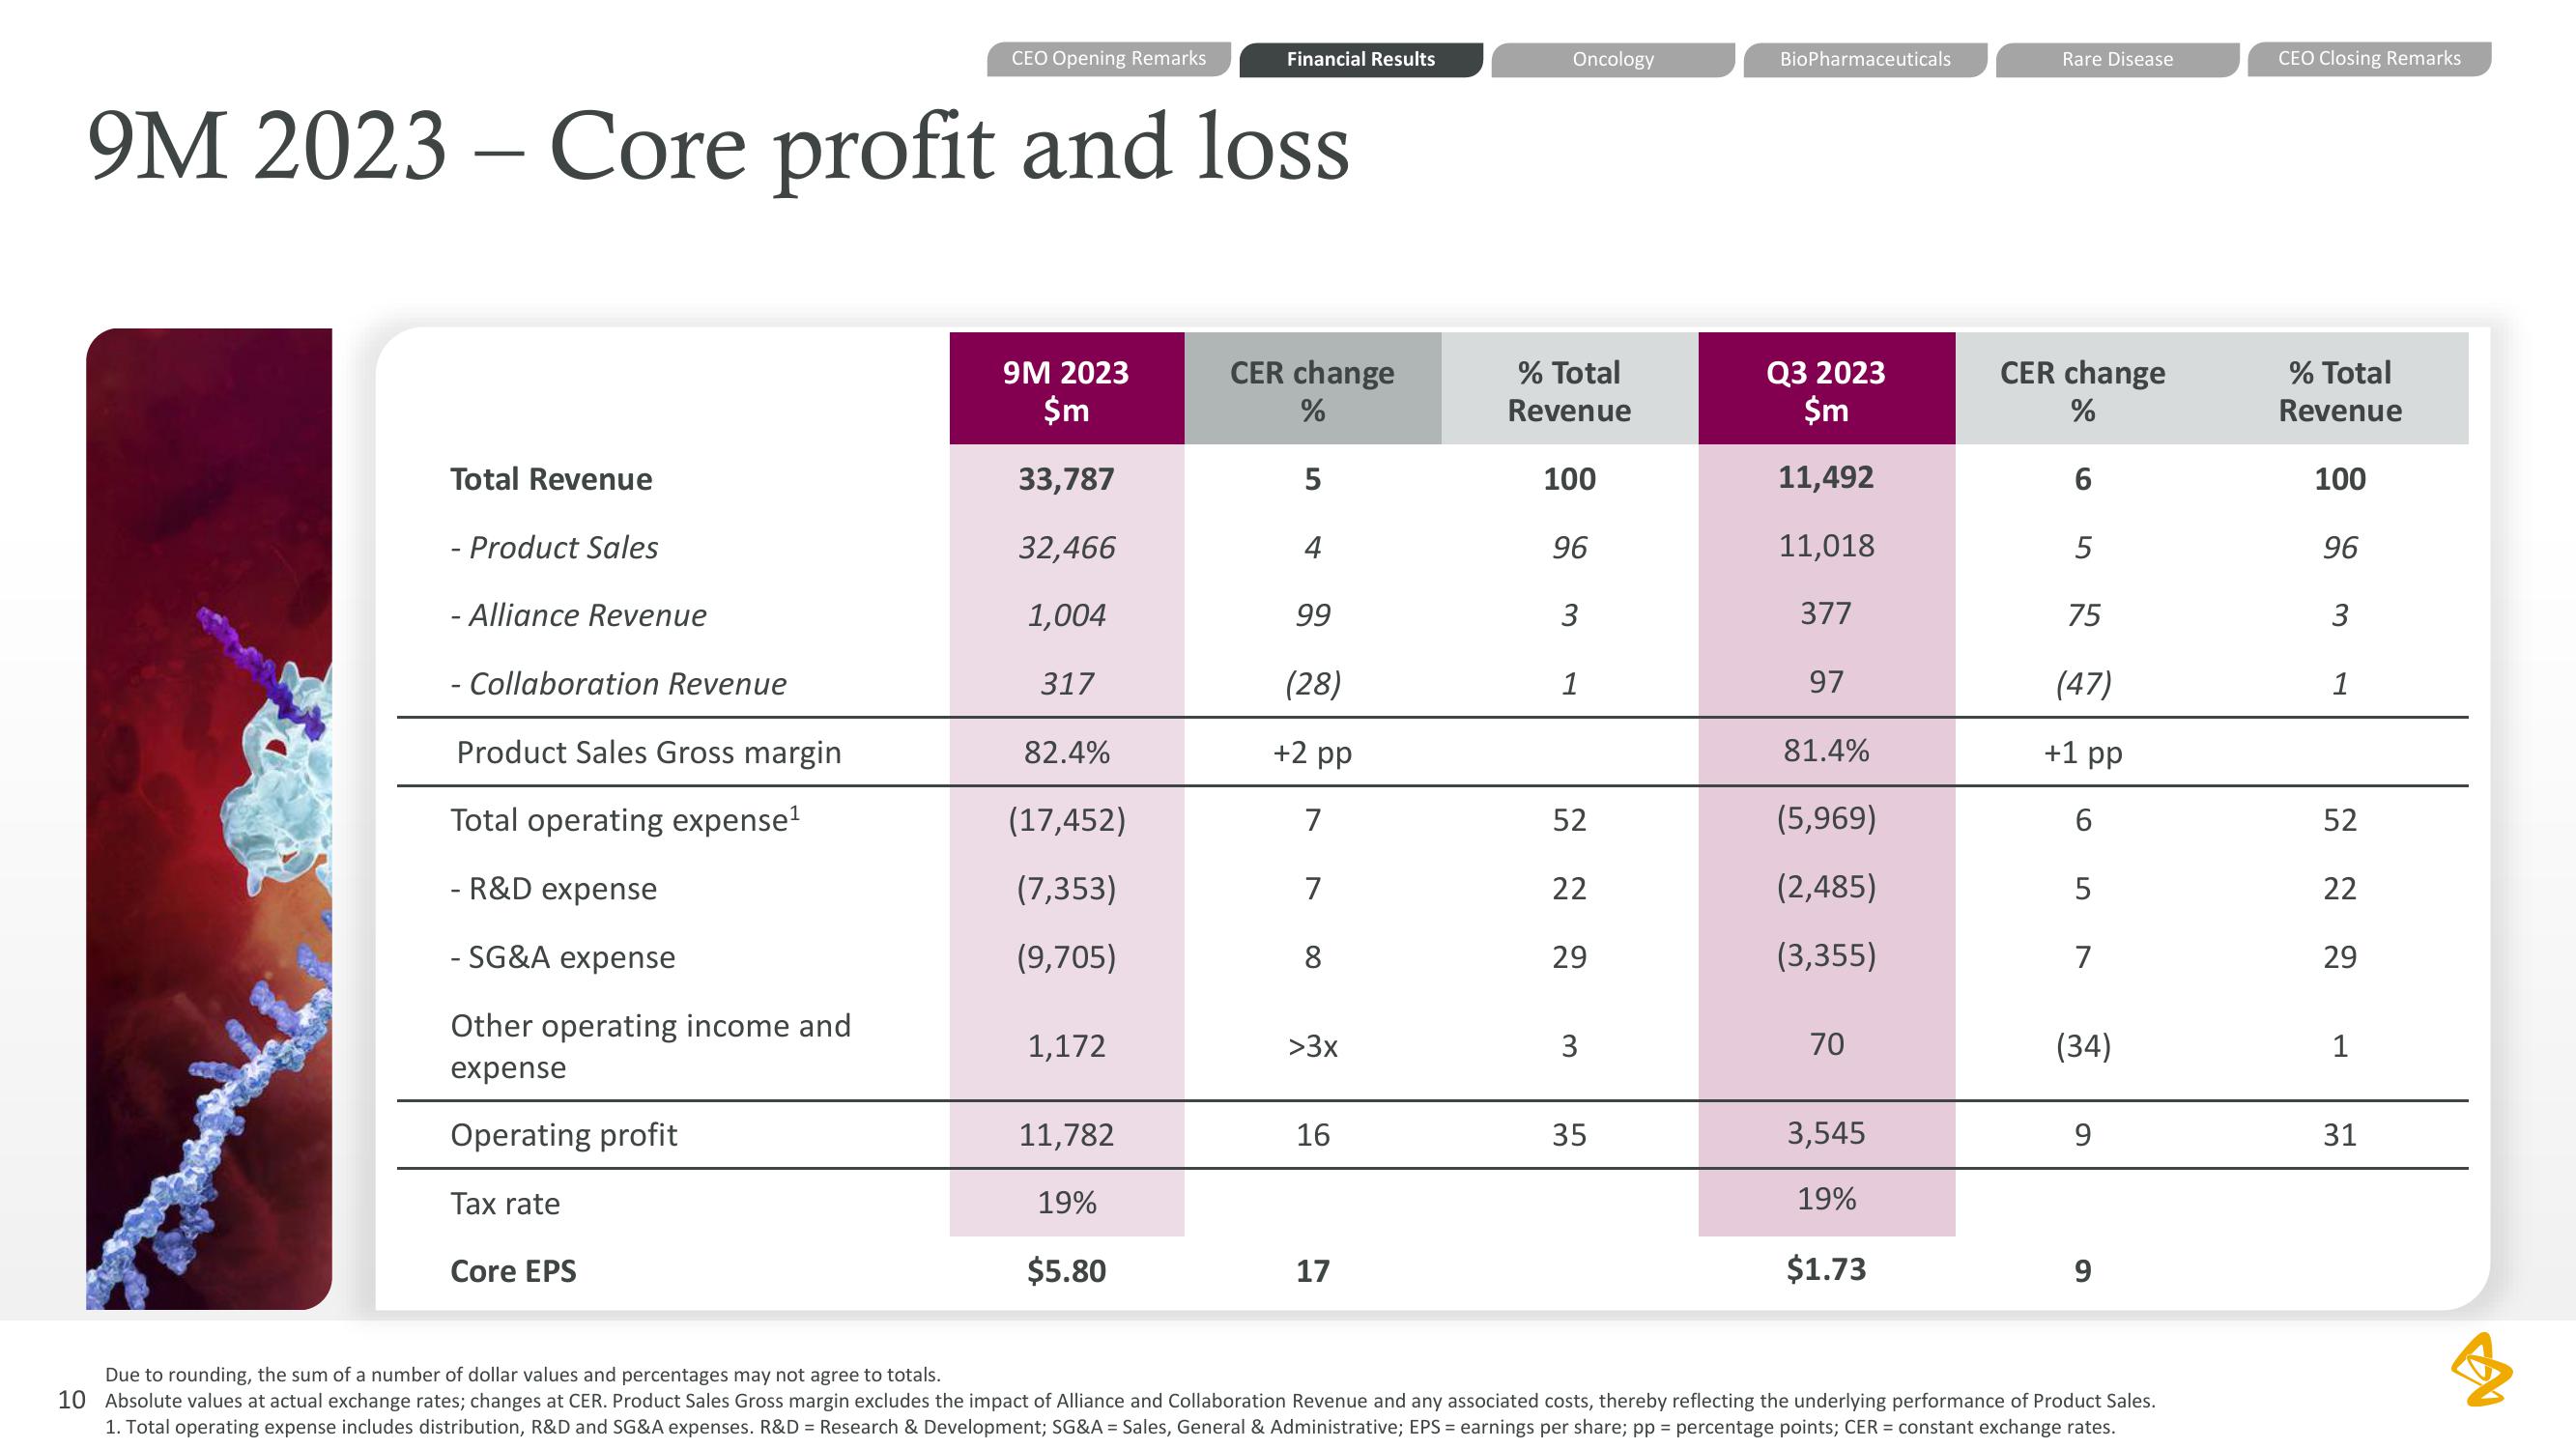
9M 2023 - Core profit and loss.
- Product Sales
- Alliance Revenue
- Collaboration Revenue
Product Sales Gross margin
Total operating expense¹
- R&D expense
- SG&A expense
Other operating income and
expense
Operating profit
Tax rate
CEO Opening Remarks
Core EPS
9M 2023
$m
33,787
32,466
1,004
317
82.4%
(17,452)
(7,353)
(9,705)
1,172
11,782
19%
Financial Results
$5.80
CER change
%
5
4
99
(28)
+2 pp
7
7
8
>3x
16
17
Oncology
% Total
Revenue
100
96
3
1
52
22
29
3
35
BioPharmaceuticals
Q3 2023
$m
11,492
11,018
377
97
81.4%
(5,969)
(2,485)
(3,355)
70
3,545
19%
$1.73
Rare Disease
CER change
%
6
5
75
(47)
+1 pp
5
7
(34)
9
9
Due to rounding, the sum of a number of dollar values and percentages may not agree to totals.
10 Absolute values at actual exchange rates; changes at CER. Product Sales Gross margin excludes the impact of Alliance and Collaboration Revenue and any associated costs, thereby reflecting the underlying performance of Product Sales.
1. Total operating expense includes distribution, R&D and SG&A expenses. R&D = Research & Development; SG&A = Sales, General & Administrative; EPS = earnings per share; pp = percentage points; CER = constant exchange rates.
CEO Closing Remarks
% Total
Revenue
100
96
3
1
52
22
29
1
31
BView entire presentation