Allwyn Results Presentation Deck
Consolidated P&L
●
●
14
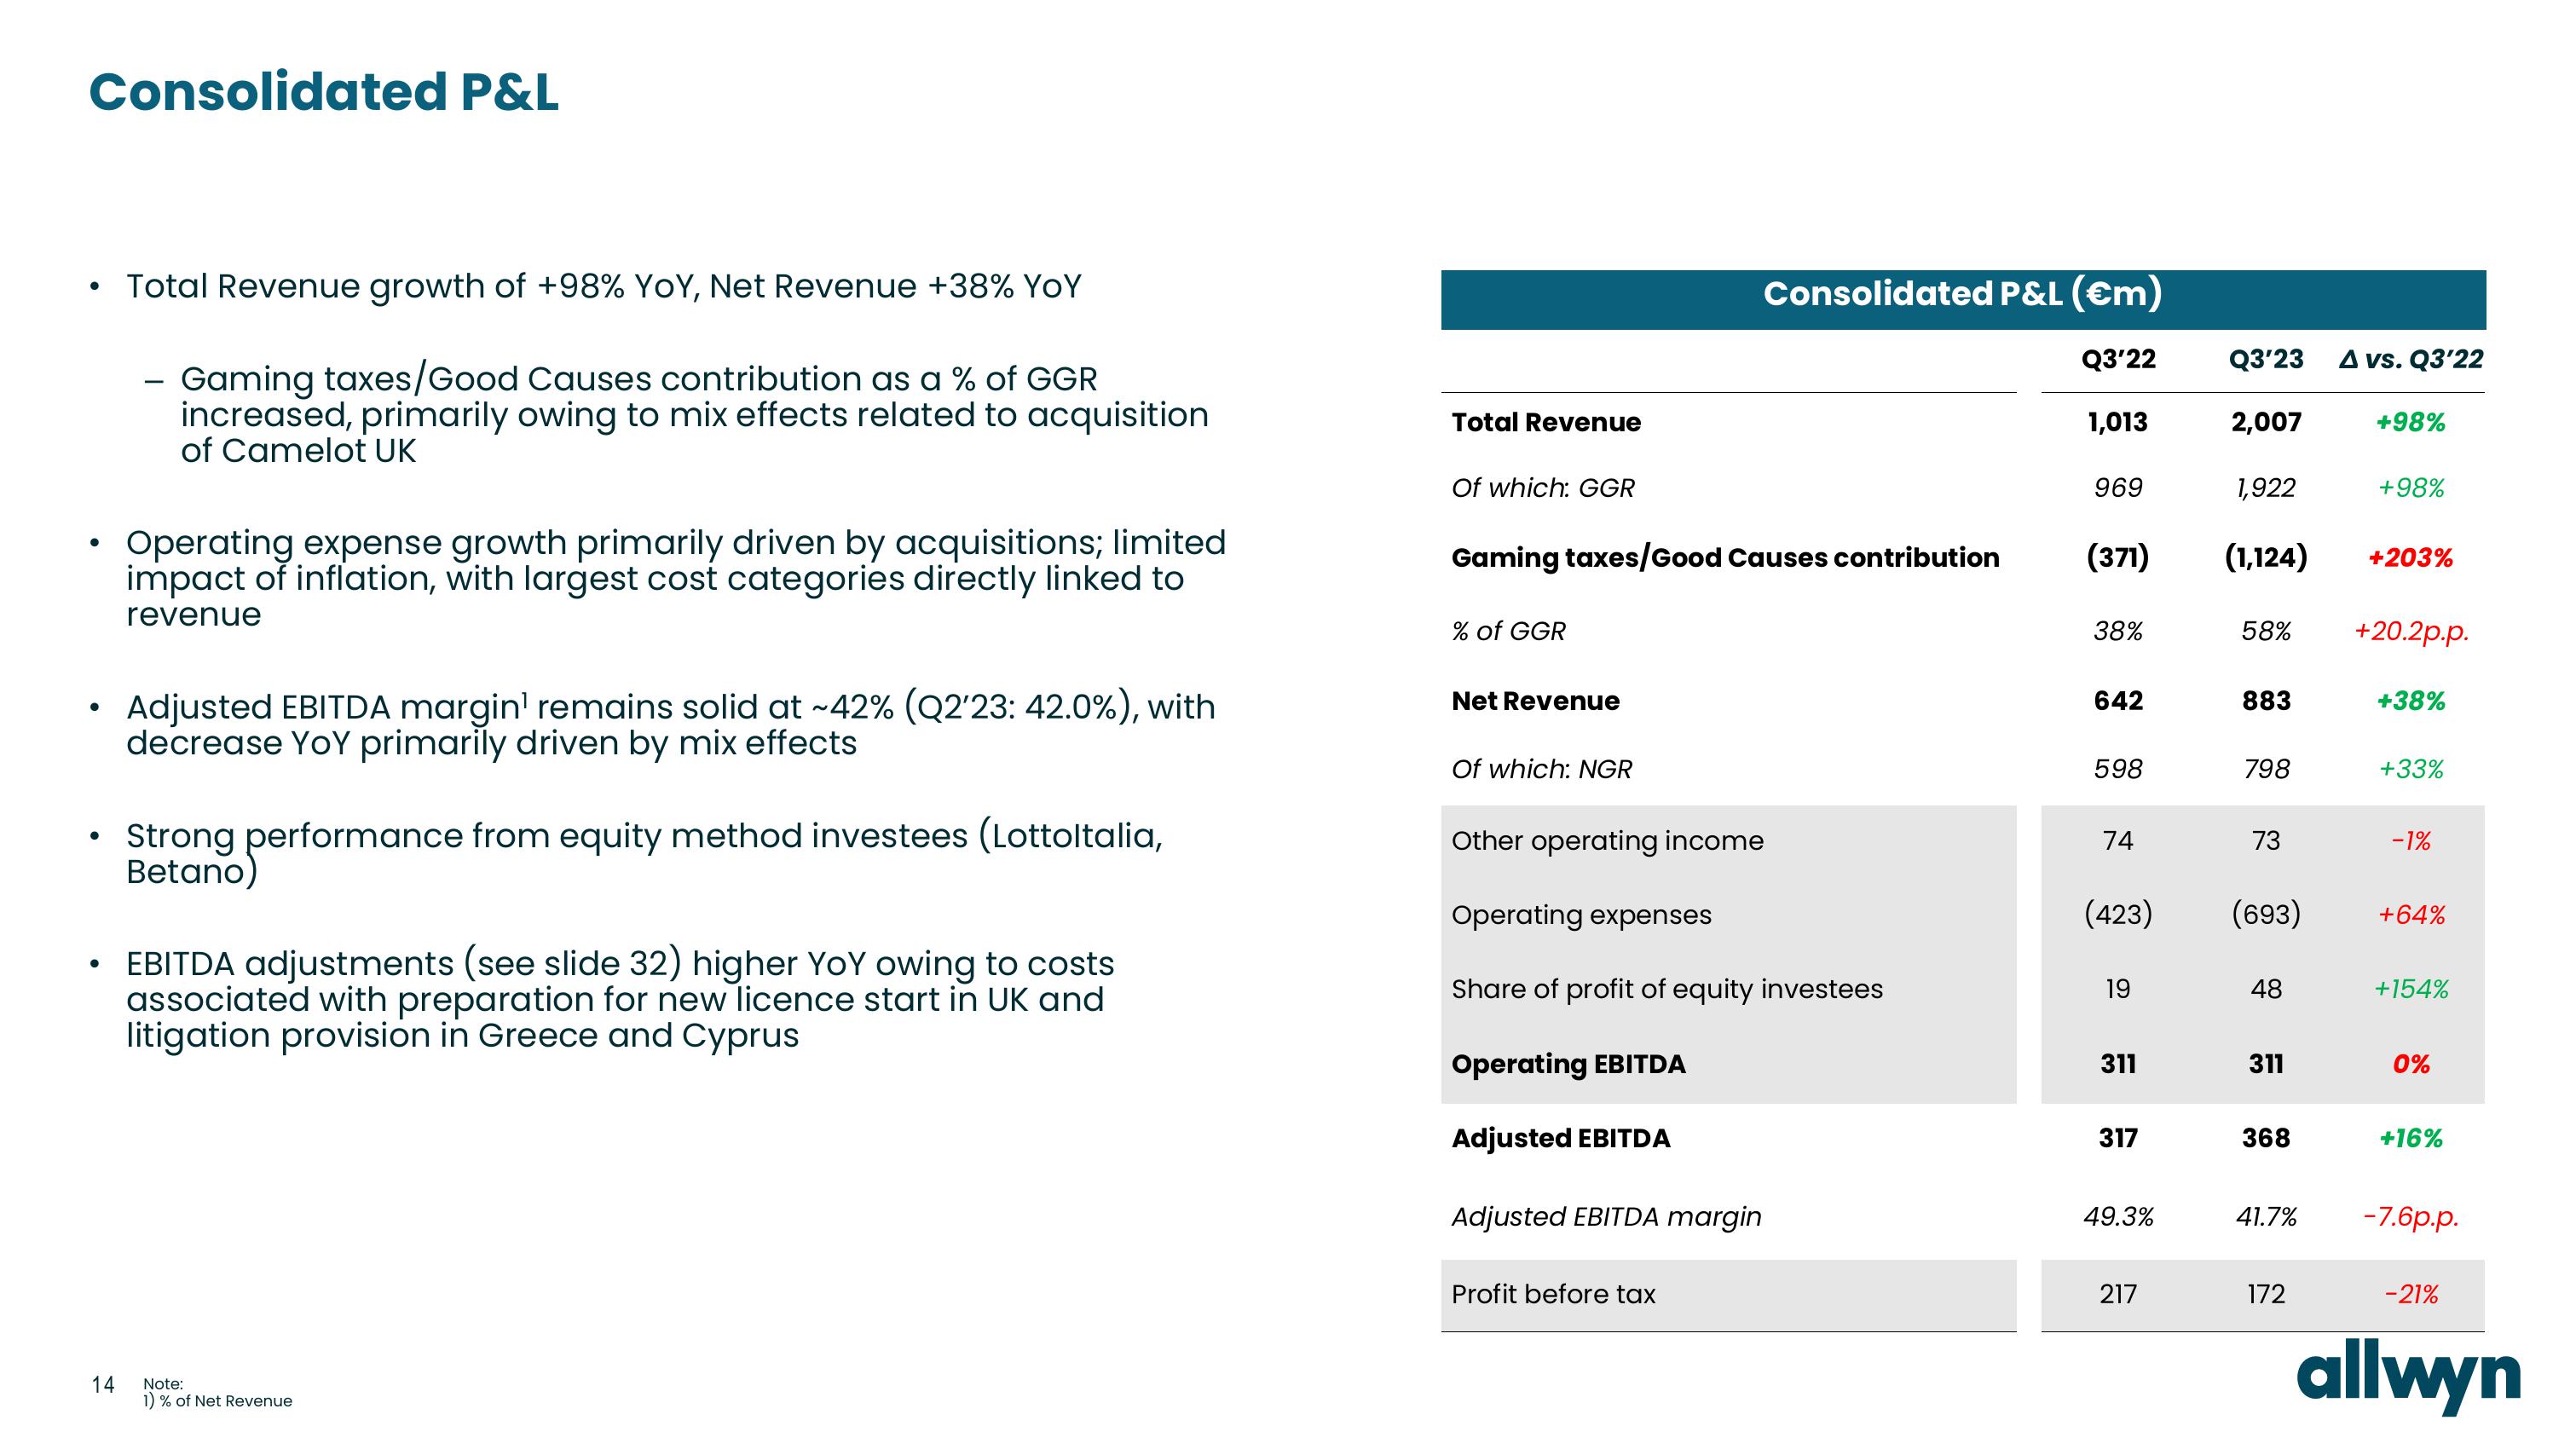
Total Revenue growth of +98% YOY, Net Revenue +38% YoY
Gaming taxes/Good Causes contribution as a % of GGR
increased, primarily owing to mix effects related to acquisition
of Camelot UK
Operating expense growth primarily driven by acquisitions; limited
impact of inflation, with largest cost categories directly linked to
revenue
Adjusted EBITDA margin¹ remains solid at ~42% (Q2'23: 42.0%), with
decrease YoY primarily driven by mix effects
Strong performance from equity method investees (Lottoltalia,
Betano)
EBITDA adjustments (see slide 32) higher YoY owing to costs
associated with preparation for new licence start in UK and
litigation provision in Greece and Cyprus
Note:
1) % of Net Revenue
Total Revenue
Of which: GGR
Gaming taxes/Good Causes contribution
% of GGR
Net Revenue
Of which: NGR
Other operating income
Operating expenses
Share of profit of equity investees
Operating EBITDA
Adjusted EBITDA
Consolidated P&L (€m)
Q3'22
1,013
Adjusted EBITDA margin
Profit before tax
969
(371)
38%
642
598
74
(423)
19
311
317
49.3%
217
Q3'23 A vs. Q3'22
2,007
1,922
(1,124)
58%
883
798
73
(693)
48
311
368
41.7%
172
+98%
+98%
+203%
+20.2p.p.
+38%
+33%
-1%
+64%
+154%
0%
+16%
-7.6p.p.
-21%
allwynView entire presentation