Evercore Investment Banking Pitch Book
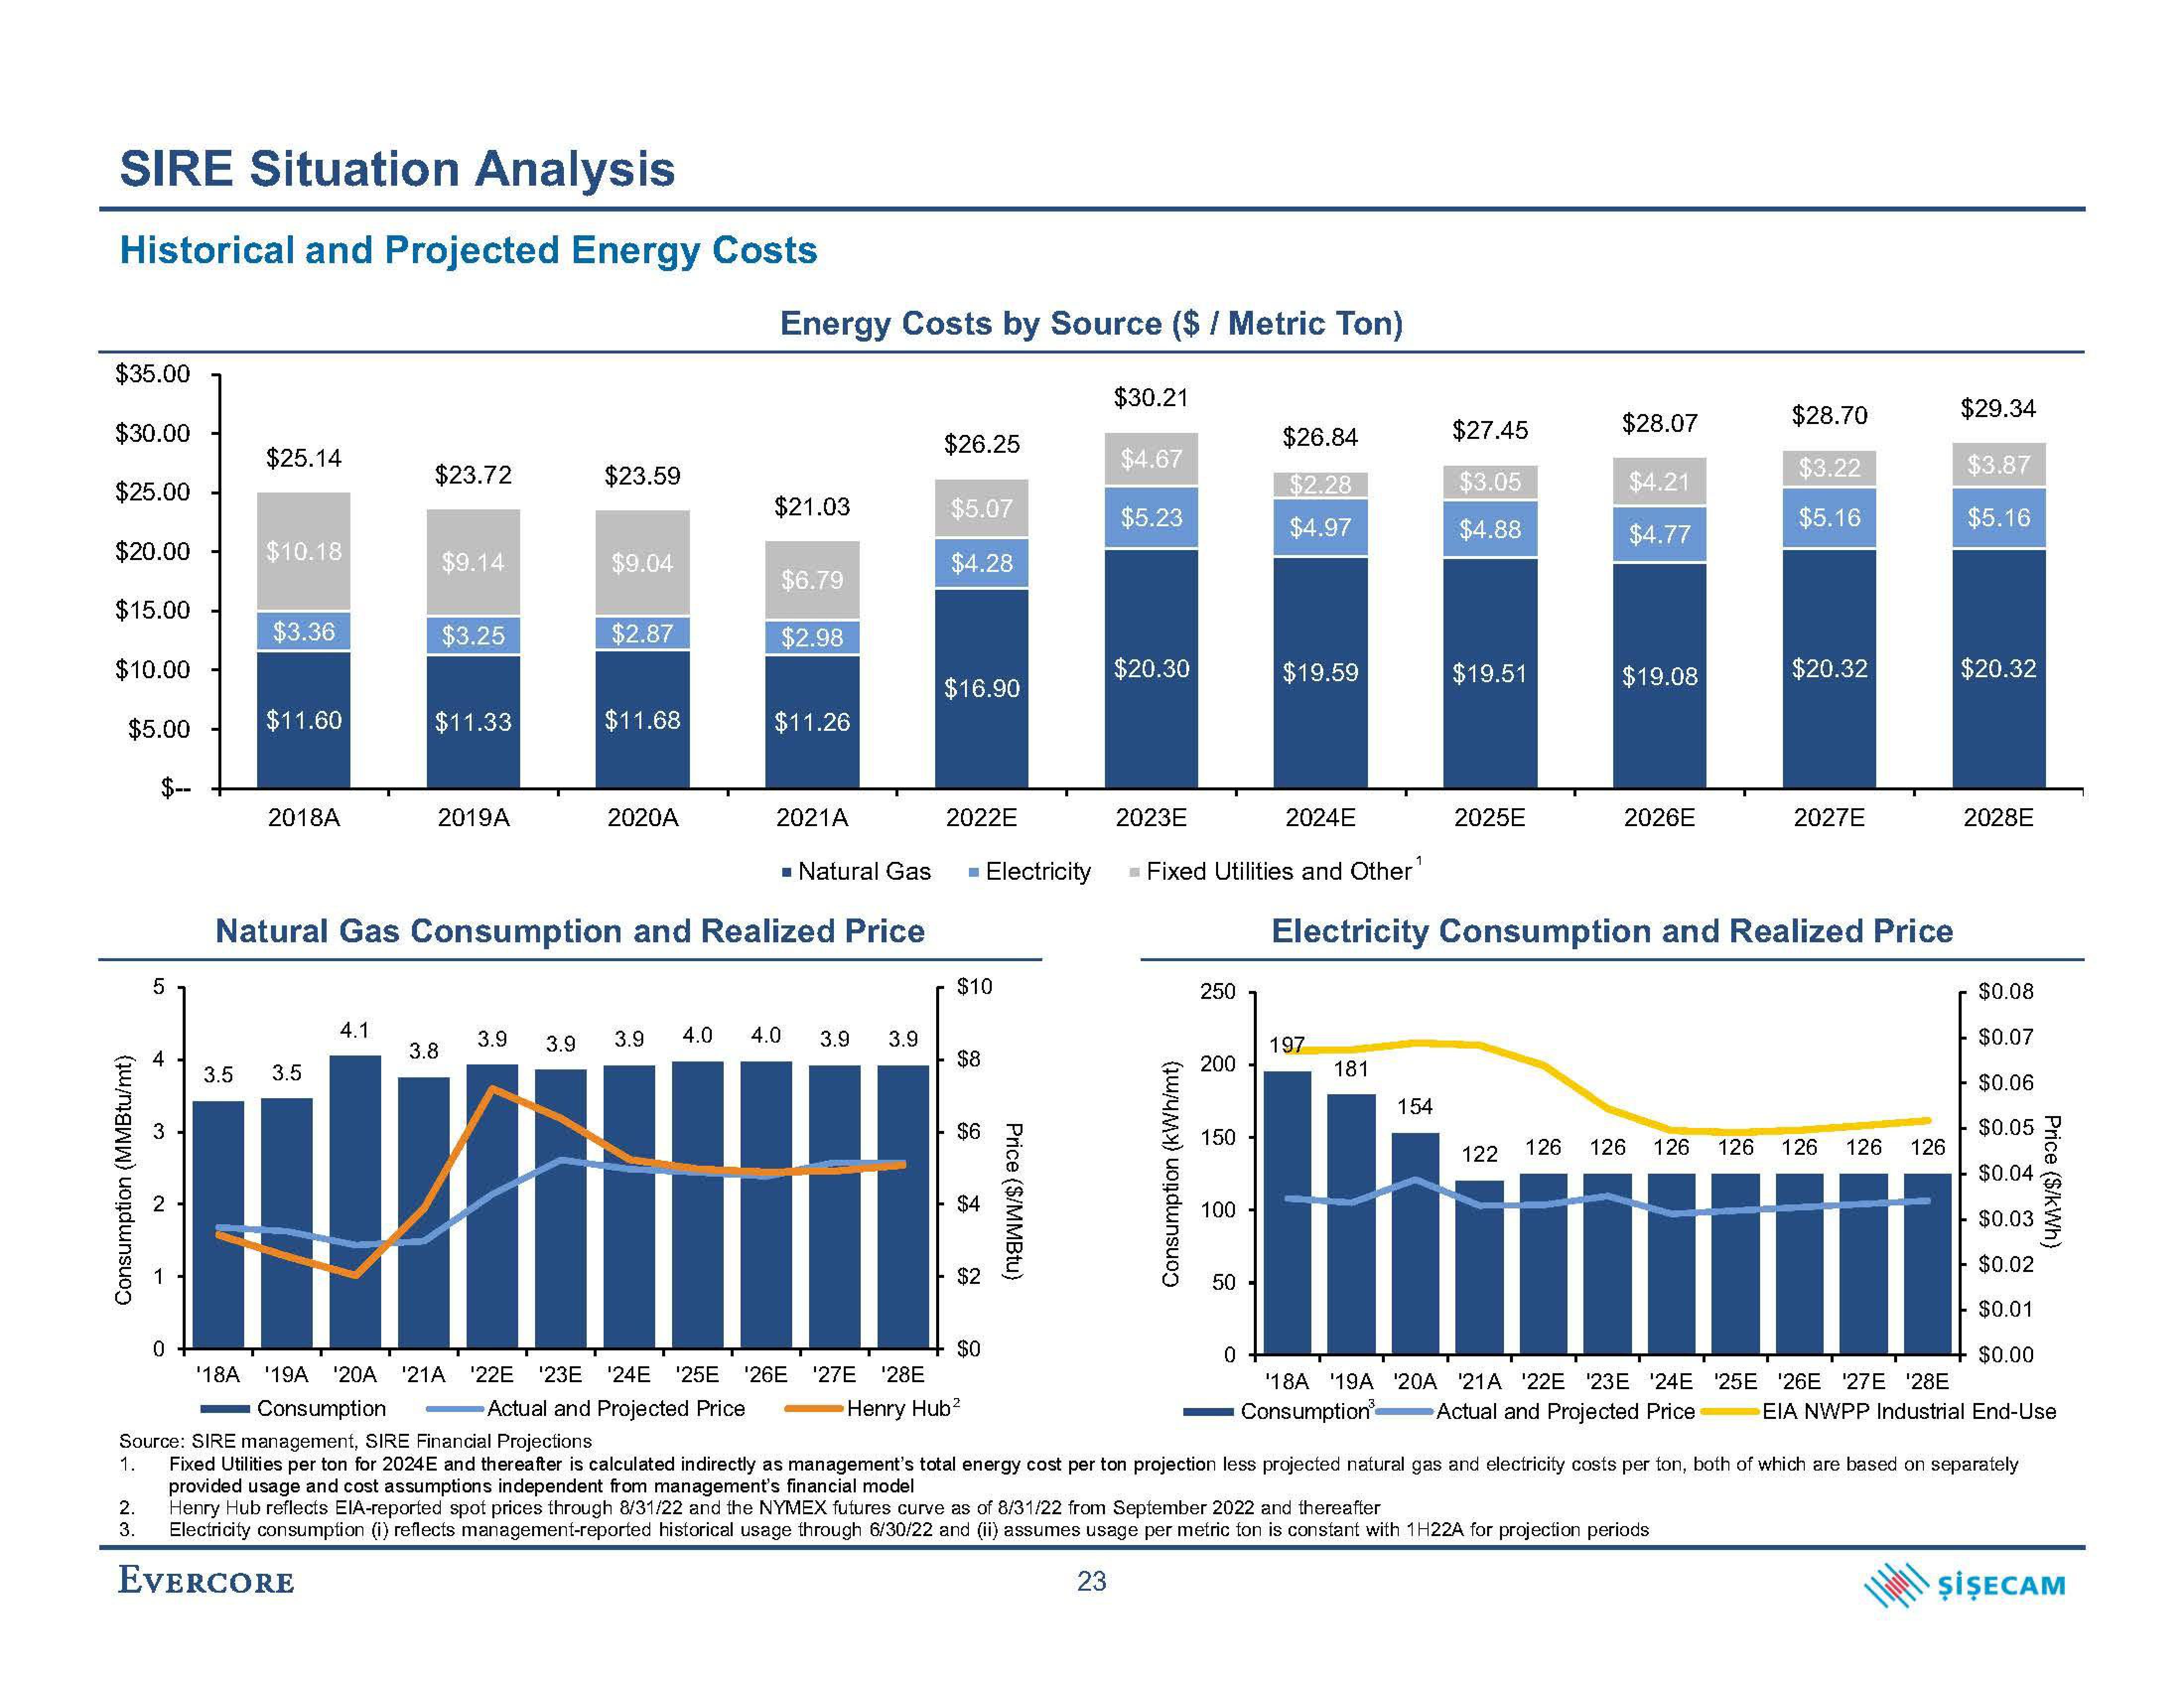
SIRE Situation Analysis
Historical and Projected Energy Costs
$35.00
$30.00
$25.00
$20.00
$15.00
$10.00
$5.00
$--
Consumption (MMBtu/mt)
5
4
2.
3.
3
0
$25.14
$10.18
$3.36
$11.60
2018A
3.5 3.5
$23.72
4.1
$9.14
$3.25
$11.33
2019A
3.8
3.9
$23.59
3.9
$9.04
$2.87
$11.68
2020A
Energy Costs by Source ($ / Metric Ton)
$21.03
Natural Gas Consumption and Realized Price
$6.79
$2.98
$11.26
2021A
3.9 4.0 4.0
'18A 19A '20A '21A ¹22E '23E '24E '25E ¹26E
Actual and Projected Price
■ Natural Gas ■ Electricity
3.9 3.9
$26.25
¹27E ¹28E
$5.07
$4.28
$16.90
2022E
$10
$8
$6
$4
$2
$0
Henry Hub²
Price (S/MMBtu)
$30.21
$4.67
$5.23
$20.30
2023E
2024E
Fixed Utilities and Other¹
Consumption (kWh/mt)
250
200
150
100
50
$26.84
$2.28
$4.97
0
$19.59
197
181
$27.45
$3.05
$4.88
154
$19.51
2025E
$28.07
$4.21
$4.77
$19.08
2026E
Electricity Consumption and Realized Price
$28.70
$3.22
$5.16
'18A '19A '20A '21A '22E '23E '24E
Consumption Actual and Projected Price
$20.32
Henry Hub reflects EIA-reported spot prices through 8/31/22 and the NYMEX futures curve as of 8/31/22 from September 2022 and thereafter
Electricity consumption (i) reflects management-reported historical usage through 6/30/22 and (ii) assumes usage per metric ton is constant with 1H22A for projection periods
EVERCORE
23
2027E
122 126 126 126 126 126 126 126
'25E '26E ¹27E '28E
$29.34
$3.87
$5.16
$20.32
Consumption
Source: SIRE management, SIRE Financial Projections
Fixed Utilities per ton for 2024E and thereafter is calculated indirectly as management's total energy cost per ton projection less projected natural gas and electricity costs per ton, both of which are based on separately
provided usage and cost assumptions independent from management's financial model
1.
2028E
$0.08
$0.07
$0.06
$0.05
$0.04
$0.03
$0.02
$0.01
$0.00
Price ($/kWh)
EIA NWPP Industrial End-Use
ŞİŞECAMView entire presentation