Evercore Investment Banking Pitch Book
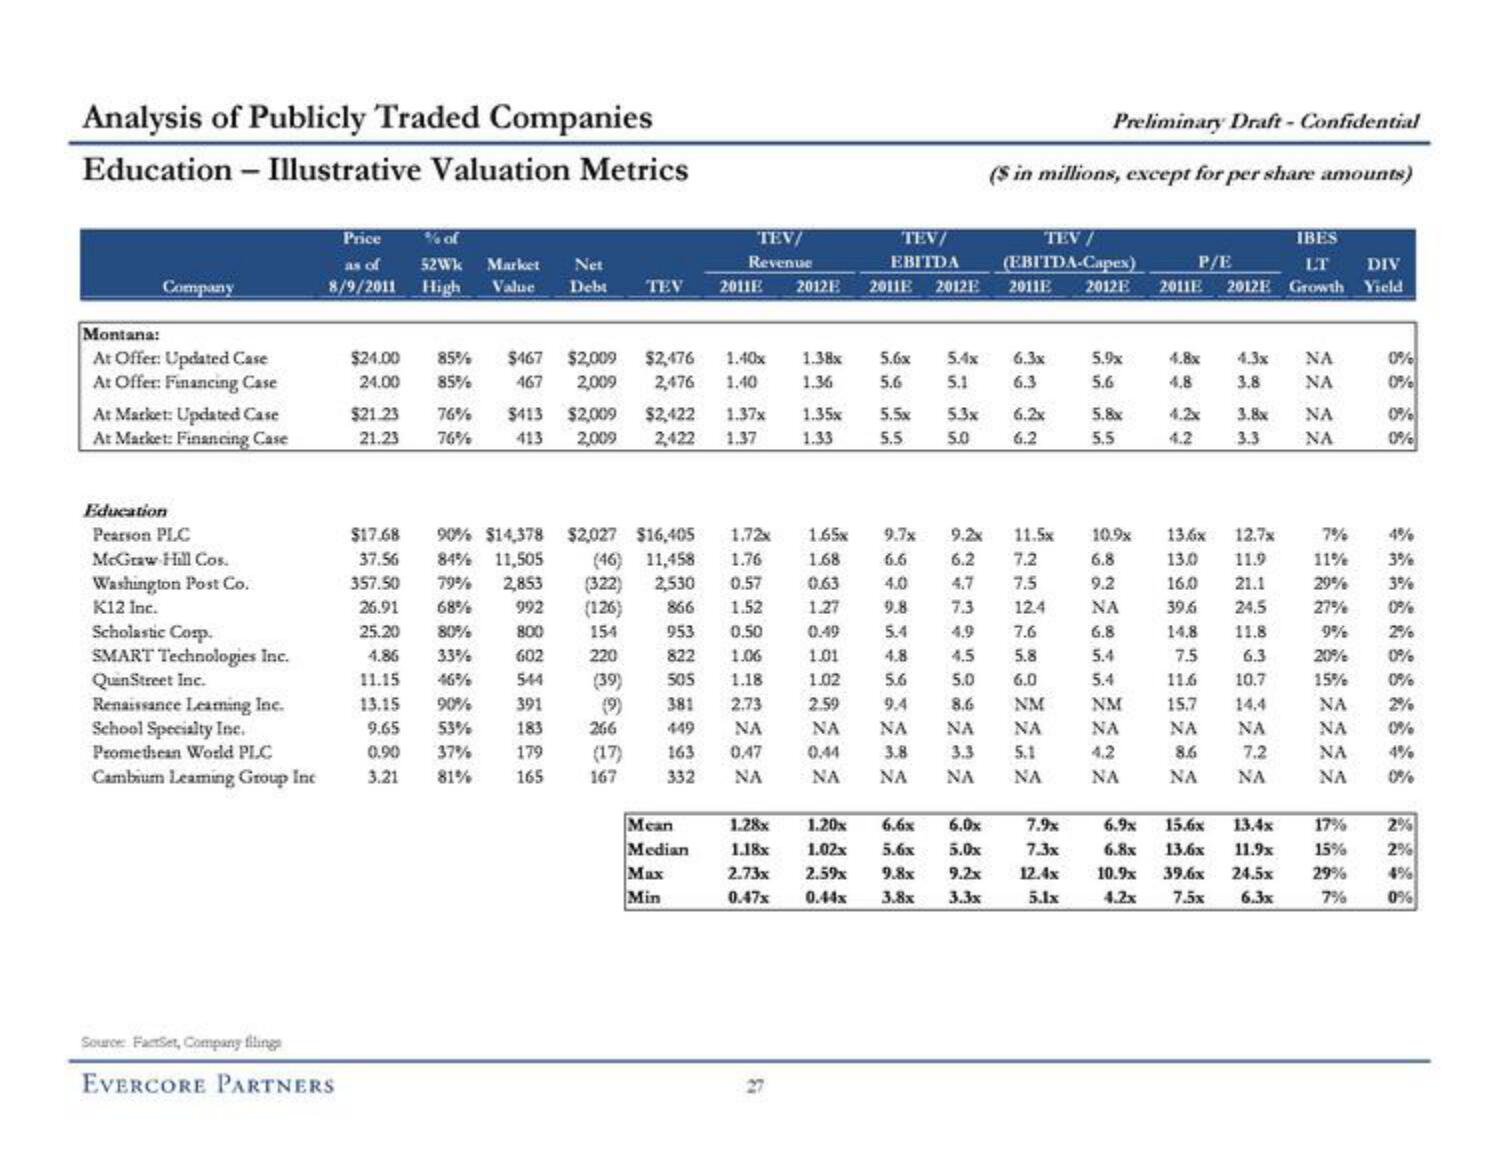
Analysis of Publicly Traded Companies
Education - Illustrative Valuation Metrics
Company
Montana:
At Offer: Updated Case
At Offer: Financing Case
At Market: Updated Case
At Market: Financing Case
Education
Pearson PLC
McGraw Hill Cos.
Washington Post Co.
K12 Inc.
Scholastic Corp.
SMART Technologies Inc.
QuinStreet Inc.
Renaissance Leaming Inc.
School Specialty Inc.
Promethean World PLC
Cambium Leaming Group Inc
Price
as of
8/9/2011
Source FactSet, Company filings
EVERCORE PARTNERS
$17.68
37.56
357.50
26.91
25.20
4.86
11.15
$24.00 85% $467 $2,009 $2,476 1.40x 1.38x
24.00 85% 467 2,009 2,476 1.40 1.36
$21.23 76% $413 $2,009 $2,422 1.37x 1.35x
21.23 76% 413 2,009 2,422 1.37 1.33
13.15
9.65
0.90
3.21
% of
52Wk
Market
Net
High Value Debt TEV 2011E 2012E 2011E 20121
90% $14,378
84% 11,505
79% 2,853
68%
992
80%
800
33%
602
544
391
183
179
165
53%
37%
81%
TEV/
Revenue
1.72x
$2,027 $16,405
(46) 11,458 1.76
(322) 2,530
0.57
(126)
866
1.52
154
953 0.50
220
822 1.06
(39)
505
1.18
(9)
381 2.73
449
266
(17)
167
NA
163 0.47
332
NA
Mean
Median
Max
Min
TEV/
EBITDA
F
5.6x 5.4x
5.6 5.1
5.5x 5.3x
5.5
5.0
6.0x
1.28x 1.20x 6.6x
1.18x 1.02x 5.6x 5.0x
2.73x 2.59x 9.8x 9.2x
0.47x 0.44x
3.8x 3.3x
Preliminary Draft- Confidential
($ in millions, except for per share amounts)
TEV /
(EBITDA-Capex)
2011E 2012E
6.3x
6.3
6.2x
6.2
1.65x 9.7x 9.2x
115
1.68
6.6
6.2
7.2
0.63
4.0
4,7 7.5
1.27
9.8
7.3
0.49
5.4
4.9
1.01
4.8
4.5
5.8
1.02
5.6
5.0
6.0
2.59
9.4
8.6
NM
ΝΑ NA
NA
NA
0.44
3.3 5.1
3.8
NA NA NA
NA
12.4
7.6
7.9x
7.3x
12.4x
5.1x
5.9x
5.6
5.8x
5.5
10.9x
6.8
9.2
NA
6.8
5.4
5.4
NM
NA
4.2
NA
IBES
LT
2011E 2012E Growth
P/E
4.8x 4.3x ΝΑ
4.8 3.8 NA
4.2x 3.8x NA
4.2
3.3
NA
13.6x
12.7x
13.0 11.9
16.0
21.1
39.6
24.5
14.8
7.5
11.6
15,7
NA
NA
8.6
7.2
NA NA
11.8
6.3
10.7
7%
11%
29%
27%
9%
20%
15%
NA
NA
NA
NA
15.6x 13.4x
17%
6.9x
6.8x 13.6x 11.9x
15%
10.9x 39.6x 21.5x 29%
4.2x
7.5x
6.3x
7%
DIV
Yield
0%
0%
0%
0%
4%
3%
3%
0%
2%
0%
0%
0%
0%
2%
2%
4%
0%View entire presentation