JD Sports Results Presentation Deck
JD
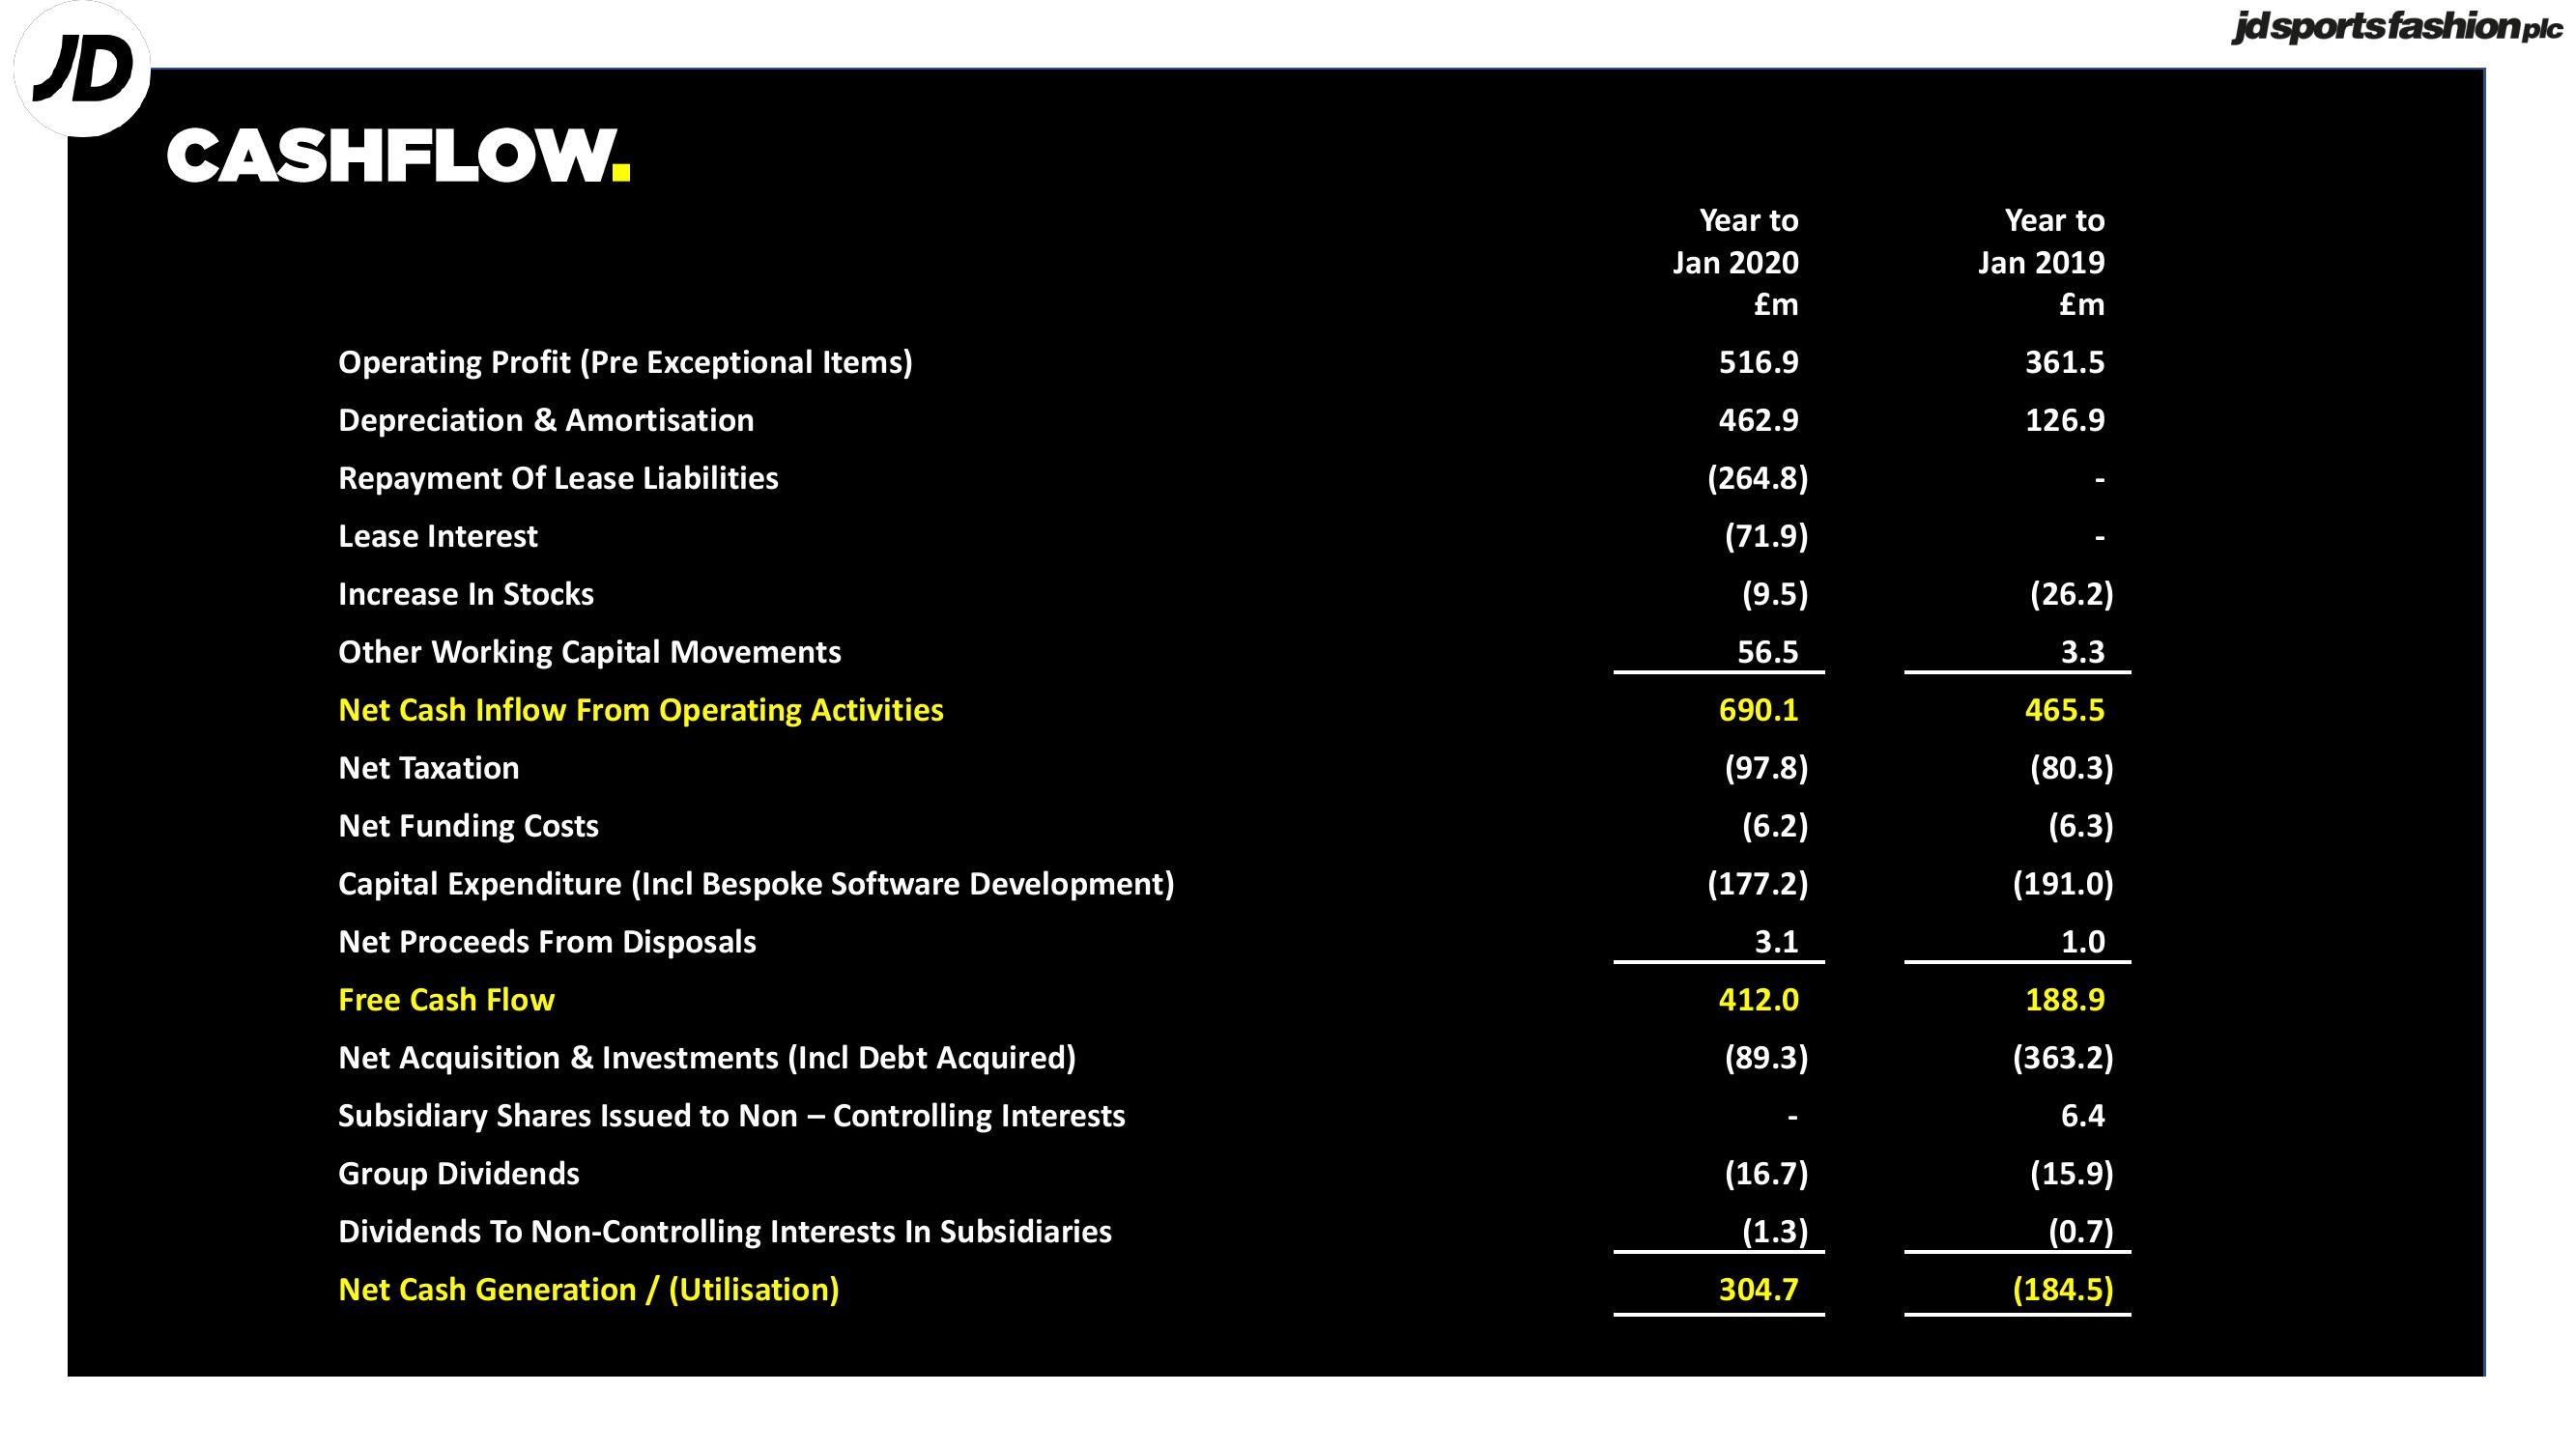
CASHFLOW.
Operating Profit (Pre Exceptional Items)
Depreciation & Amortisation
Repayment Of Lease Liabilities
Lease Interest
Increase In Stocks
Other Working Capital Movements
Net Cash Inflow From Operating Activities
Net Taxation
Net Funding Costs
Capital Expenditure (Incl Bespoke Software Development)
Net Proceeds From Disposals
Free Cash Flow
Net Acquisition & Investments (Incl Debt Acquired)
Subsidiary Shares Issued to Non - Controlling Interests
Group Dividends
Dividends To Non-Controlling Interests In Subsidiaries
Net Cash Generation / (Utilisation)
Year to
Jan 2020
£m
516.9
462.9
(264.8)
(71.9)
(9.5)
56.5
690.1
(97.8)
(6.2)
(177.2)
3.1
412.0
(89.3)
(16.7)
(1.3)
304.7
Year to
Jan 2019
£m
361.5
126.9
(26.2)
3.3
465.5
(80.3)
(6.3)
(191.0)
1.0
188.9
(363.2)
6.4
(15.9)
(0.7)
(184.5)
jd sports fashion plcView entire presentation