Shopify Investor Presentation Deck
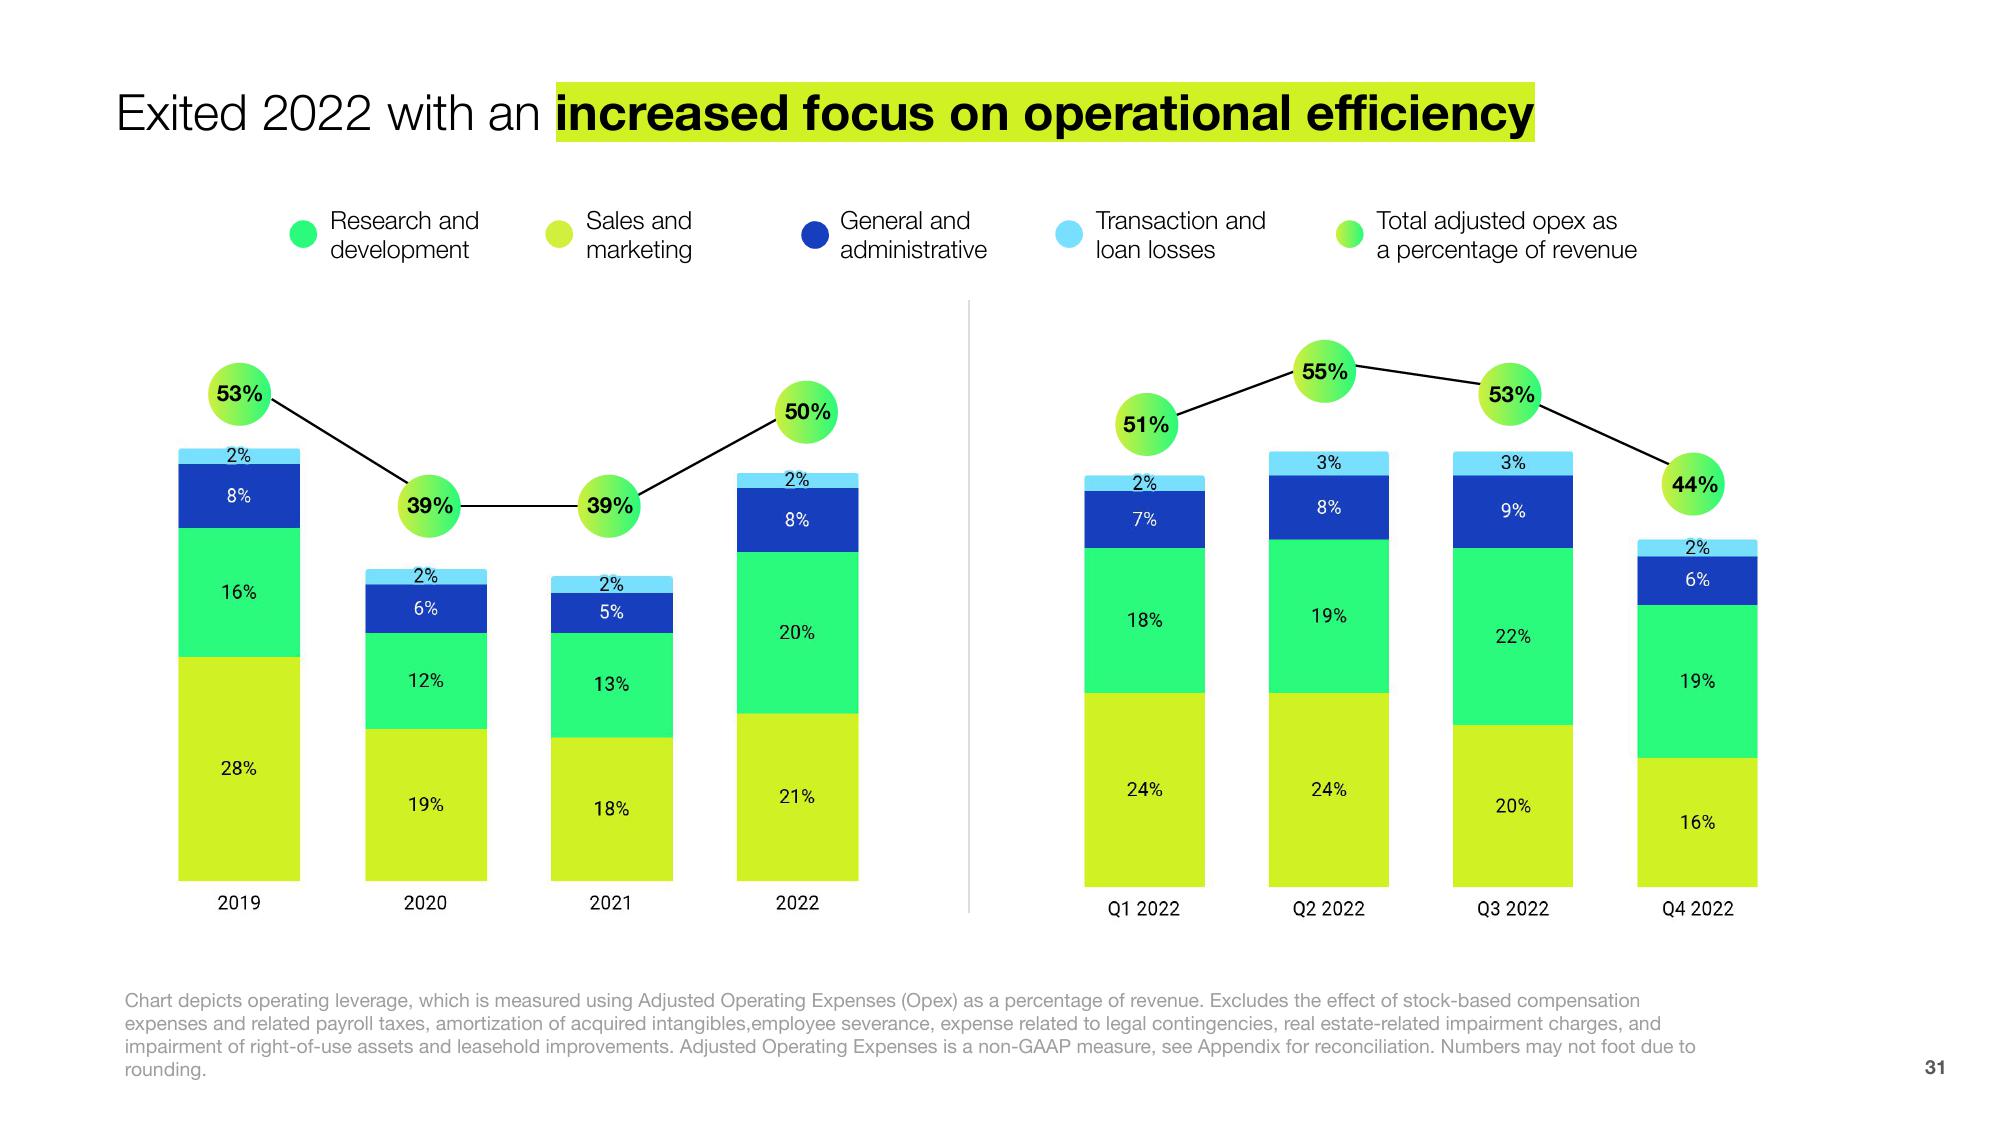
Exited 2022 with an increased focus on operational efficiency
Research and
development
Sales and
marketing
General and
administrative
Transaction and
loan losses
53%
2%
8%
16%
28%
2019
39%
2%
6%
12%
19%
2020
39%
2%
5%
13%
18%
2021
50%
2%
8%
20%
21%
2022
51%
2%
7%
18%
24%
Q1 2022
55%
3%
8%
19%
24%
Q2 2022
Total adjusted opex as
a percentage of revenue
53%
3%
9%
22%
20%
Q3 2022
44%
2%
6%
19%
16%
Q4 2022
Chart depicts operating leverage, which is measured using Adjusted Operating Expenses (Opex) as a percentage of revenue. Excludes the effect of stock-based compensation
expenses and related payroll taxes, amortization of acquired intangibles, employee severance, expense related to legal contingencies, real estate-related impairment charges, and
impairment of right-of-use assets and leasehold improvements. Adjusted Operating Expenses is a non-GAAP measure, see Appendix for reconciliation. Numbers may not foot due to
rounding.
31View entire presentation