OppFi Results Presentation Deck
3Q21 Key Performance Indicators
($ in 000s, except Total
Marking Cost)
Net Originations¹
Ending Receivables²
% of Originations by
Bank Partners
Net Charge-Offs as % of
Average Receivables³
Total Revenue Yield
Automatic Approval
Rate4
Total Marketing Cost per
Funded Loans
Total Marketing Cost per
New Funded Loan
5
9/30/2021
$164,546
$293,279
93%
36%
131%
58%
$89
$255
Unaudited
Three Months Ended
6/30/2021
$143,983
$260,377
93%
28%
129%
51%
$72
$245
9/30/2020
$131,236
$240,275
65%
24%
128%
21%
$62
$212
Key Highlights
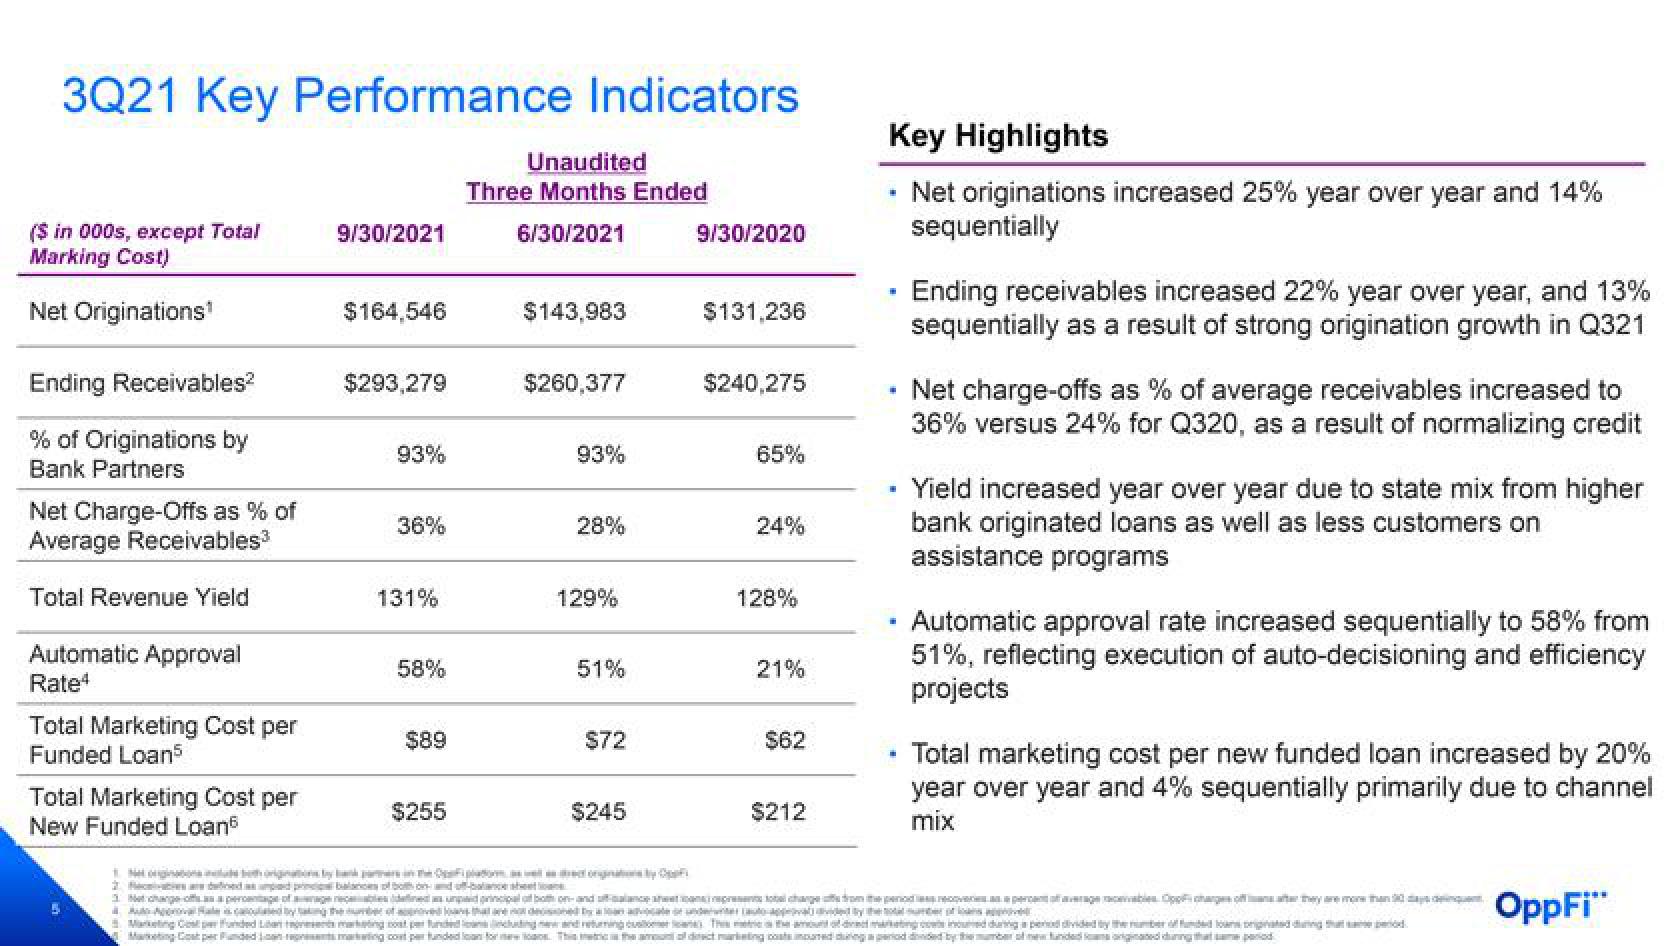
Net originations increased 25% year over year and 14%
sequentially
.
W
.
Ending receivables increased 22% year over year, and 13%
sequentially as a result of strong origination growth in Q321
Net charge-offs as % of average receivables increased to
36% versus 24% for Q320, as a result of normalizing credit
Yield increased year over year due to state mix from higher
bank originated loans as well as less customers on
assistance programs
Automatic approval rate increased sequentially to 58% from
51%, reflecting execution of auto-decisioning and efficiency
projects
Total marketing cost per new funded loan increased by 20%
year over year and 4% sequentially primarily due to channel.
mix
Avi Hale is calculated by taking the number of approved loans that are not desoned by a loan advocate or underver auto-approval dvided by the total sunder of loans approved.
5. Marketing Cost perfunded Liten represents making cost perfunded leading and returning cusThe amount of direct marketing concurred during a period divided by the number of funded loans originated during that same period.
OppFi"View entire presentation