Silicon Valley Bank Results Presentation Deck
Non-GAAP reconciliation
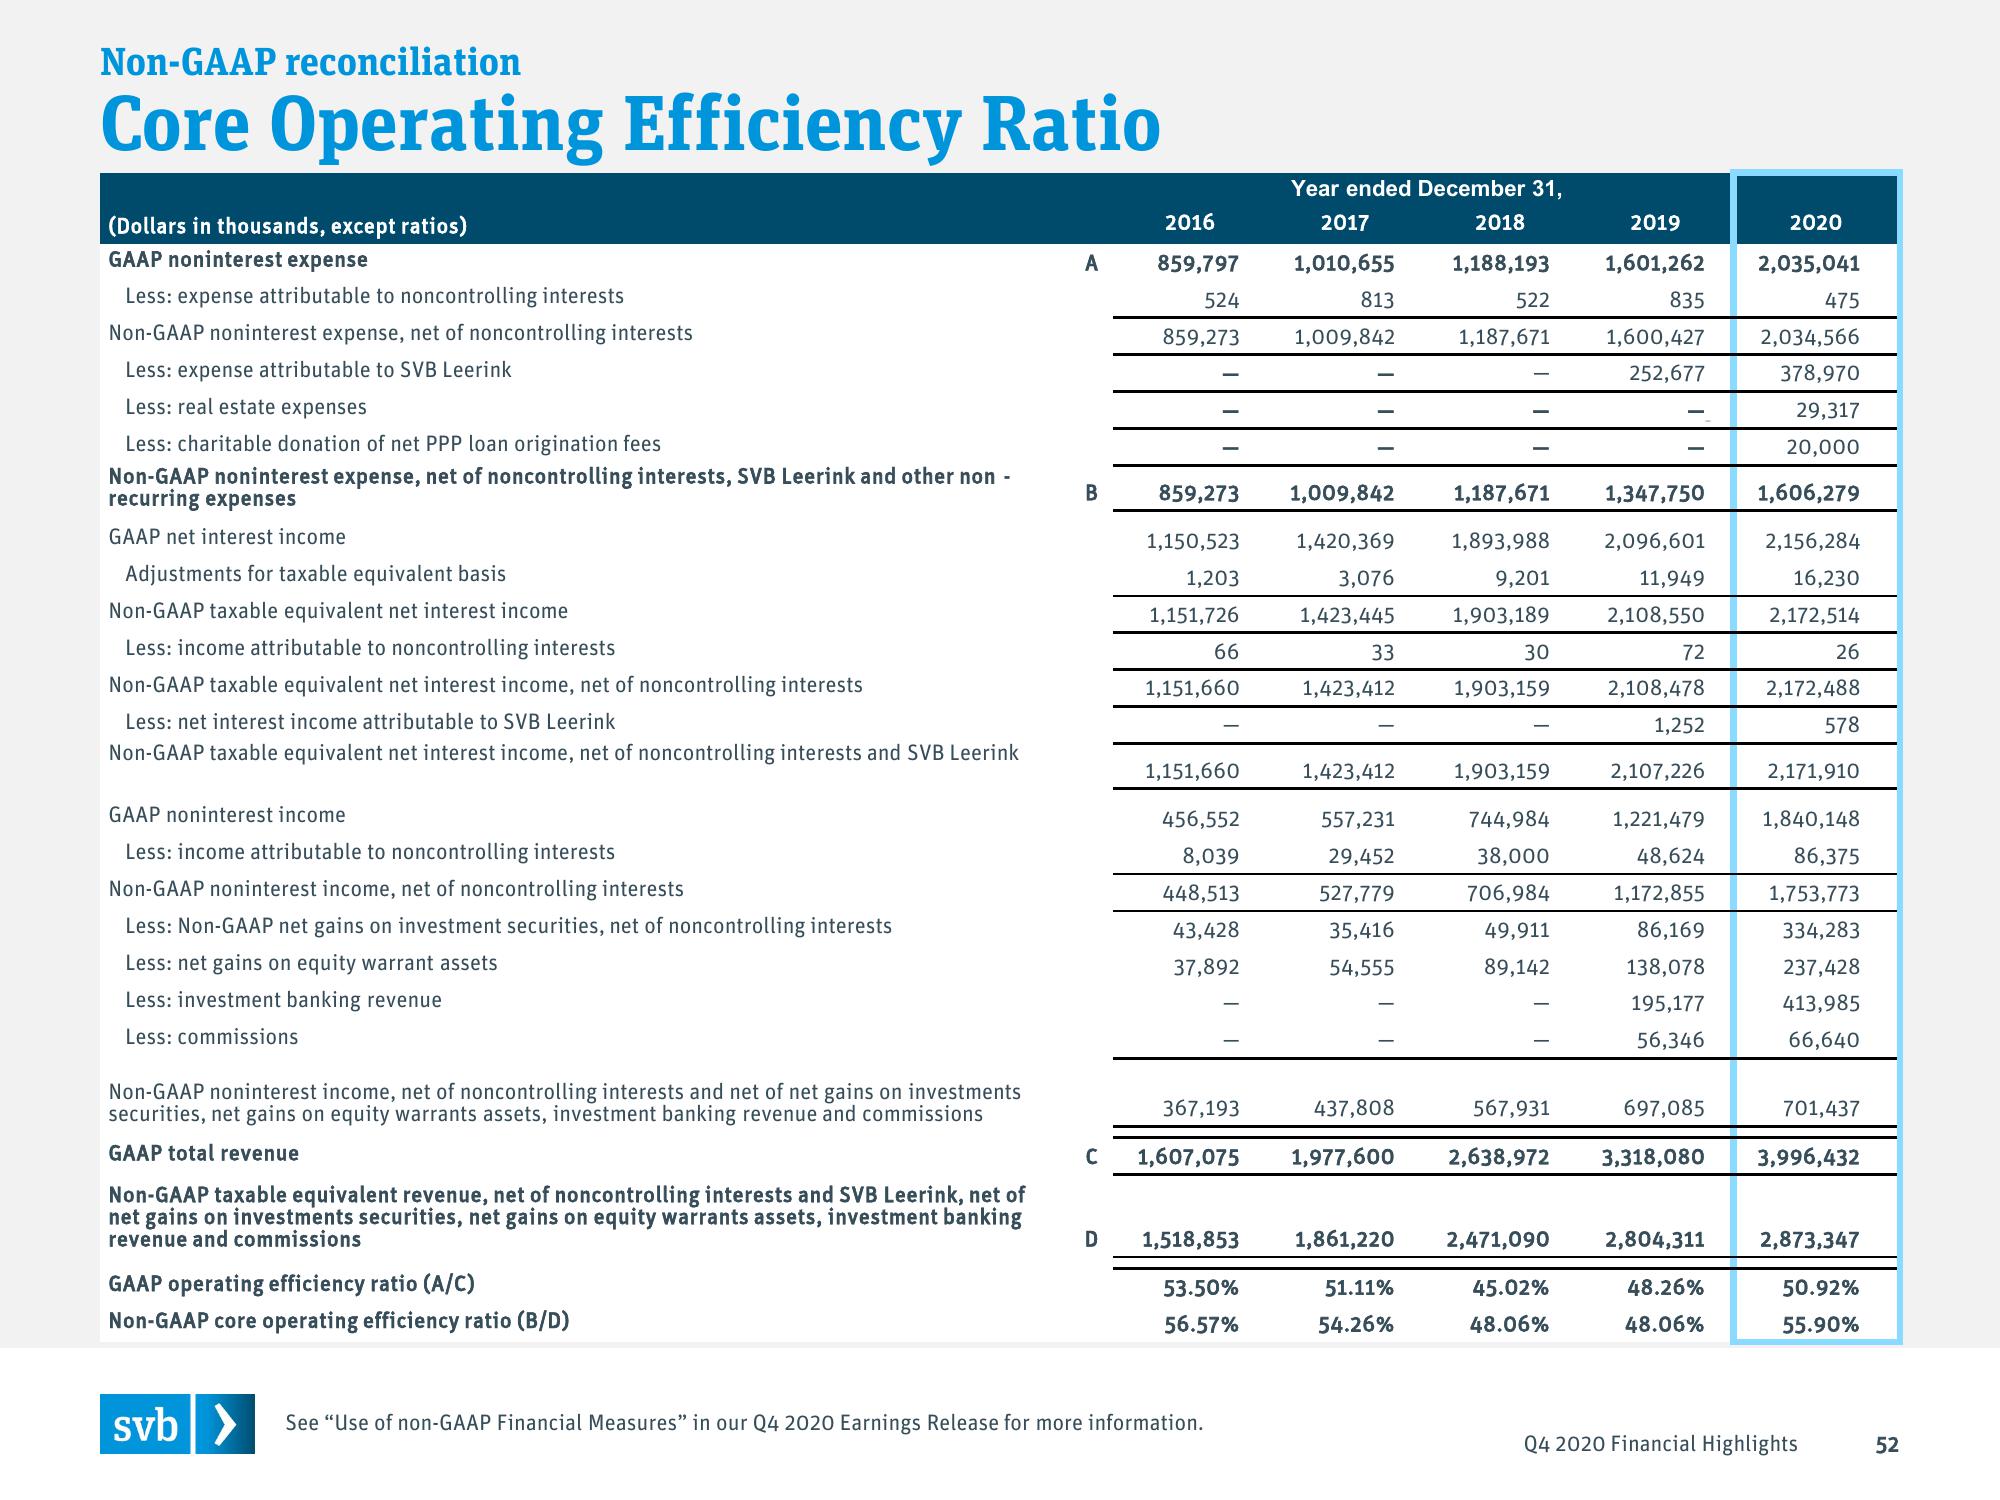
Core Operating Efficiency Ratio
(Dollars in thousands, except ratios)
GAAP noninterest expense
Less: expense attributable to noncontrolling interests
Non-GAAP noninterest expense, net of noncontrolling interests
Less: expense attributable to SVB Leerink
Less: real estate expenses
Less: charitable donation of net PPP loan origination fees
Non-GAAP noninterest expense, net of noncontrolling interests, SVB Leerink and other non-
recurring expenses
GAAP net interest income
Adjustments for taxable equivalent basis
Non-GAAP taxable equivalent net interest income
Less: income attributable to noncontrolling interests
Non-GAAP taxable equivalent net interest income, net of noncontrolling interests
Less: net interest income attributable to SVB Leerink
Non-GAAP taxable equivalent net interest income, net of noncontrolling interests and SVB Leerink
GAAP noninterest income
Less: income attributable to noncontrolling interests
Non-GAAP noninterest income, net of noncontrolling interests
Less: Non-GAAP net gains on investment securities, net of noncontrolling interests
Less: net gains on equity warrant assets
Less: investment banking revenue
Less: commissions
Non-GAAP noninterest income, net of noncontrolling interests and net of net gains on investments
securities, net gains on equity warrants assets, investment banking revenue and commissions
GAAP total revenue
Non-GAAP taxable equivalent revenue, net of noncontrolling interests and SVB Leerink, net of
net gains on investments securities, net gains on equity warrants assets, investment banking
revenue and commissions
GAAP operating efficiency ratio (A/C)
Non-GAAP core operating efficiency ratio (B/D)
A
B
2016
859,797
524
859,273
D
859,273
1,150,523
1,203
1,151,726
66
1,151,660
1,151,660
456,552
8,039
448,513
43,428
37,892
367,193
C 1,607,075
1,518,853
53.50%
56.57%
svb > See "Use of non-GAAP Financial Measures" in our Q4 2020 Earnings Release for more information.
Year ended December 31,
2017
1,010,655
2018
1,188,193
813
1,009,842
1,009,842
1,420,369
3,076
1,423,445
33
1,423,412
1,423,412
557,231
29,452
527,779
35,416
54,555
437,808
1,977,600
522
51.11%
54.26%
1,187,671
1,187,671
1,893,988
9,201
1,903,189
30
1,903,159
1,903,159
744,984
38,000
706,984
49,911
89,142
567,931
2,638,972
1,861,220 2,471,090
45.02%
48.06%
2019
1,601,262
835
1,600,427
252,677
-
1,347,750
2,096,601
11,949
2,108,550
72
2,108,478
1,252
2,107,226
1,221,479
48,624
1,172,855
86,169
138,078
195,177
56,346
2,804,311
2020
2,035,041
48.26%
48.06%
475
2,034,566
378,970
29,317
20,000
1,606,279
2,156,284
16,230
2,172,514
26
2,172,488
578
2,171,910
697,085
701,437
3,318,080 3,996,432
1,840,148
86,375
1,753,773
334,283
237,428
413,985
66,640
Q4 2020 Financial Highlights
2,873,347
50.92%
55.90%
52View entire presentation