Grab Results Presentation Deck
Q2 2022 Results
Net Cash Liquidity
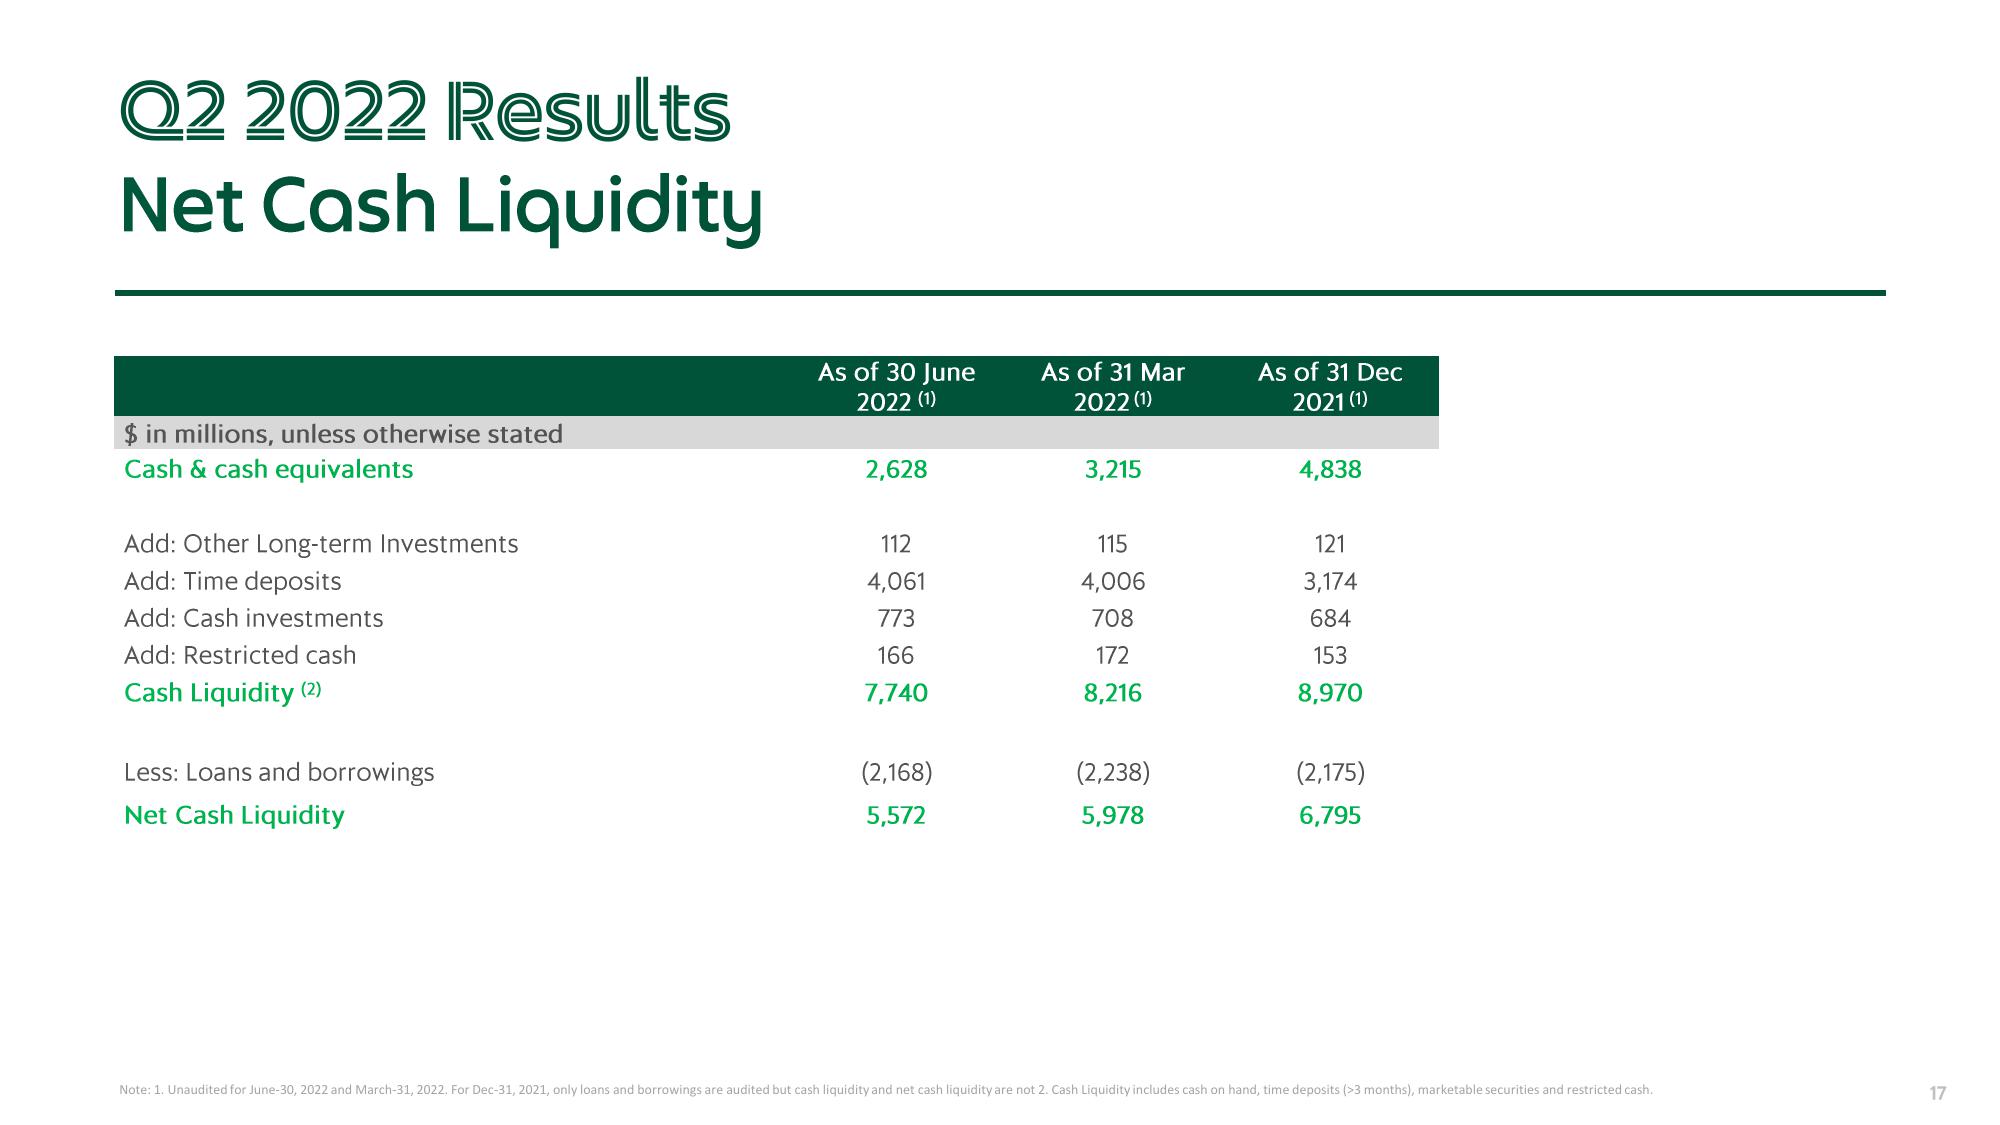
$ in millions, unless otherwise stated
Cash & cash equivalents
Add: Other Long-term Investments
Add: Time deposits
Add: Cash investments
Add: Restricted cash
Cash Liquidity (2)
Less: Loans and borrowings
Net Cash Liquidity
As of 30 June
2022 (1)
2,628
112
4,061
773
166
7,740
(2,168)
5,572
As of 31 Mar
2022 (1)
3,215
115
4,006
708
172
8,216
(2,238)
5,978
As of 31 Dec
2021 (1)
4,838
121
3,174
684
153
8,970
(2,175)
6,795
Note: 1. Unaudited for June-30, 2022 and March-31, 2022, For Dec-31, 2021, only loans and borrowings are audited but cash liquidity and net cash liquidity are not 2. Cash Liquidity includes cash on hand, time deposits (>3 months), marketable securities and restricted cash.
17View entire presentation