Lyft Results Presentation Deck
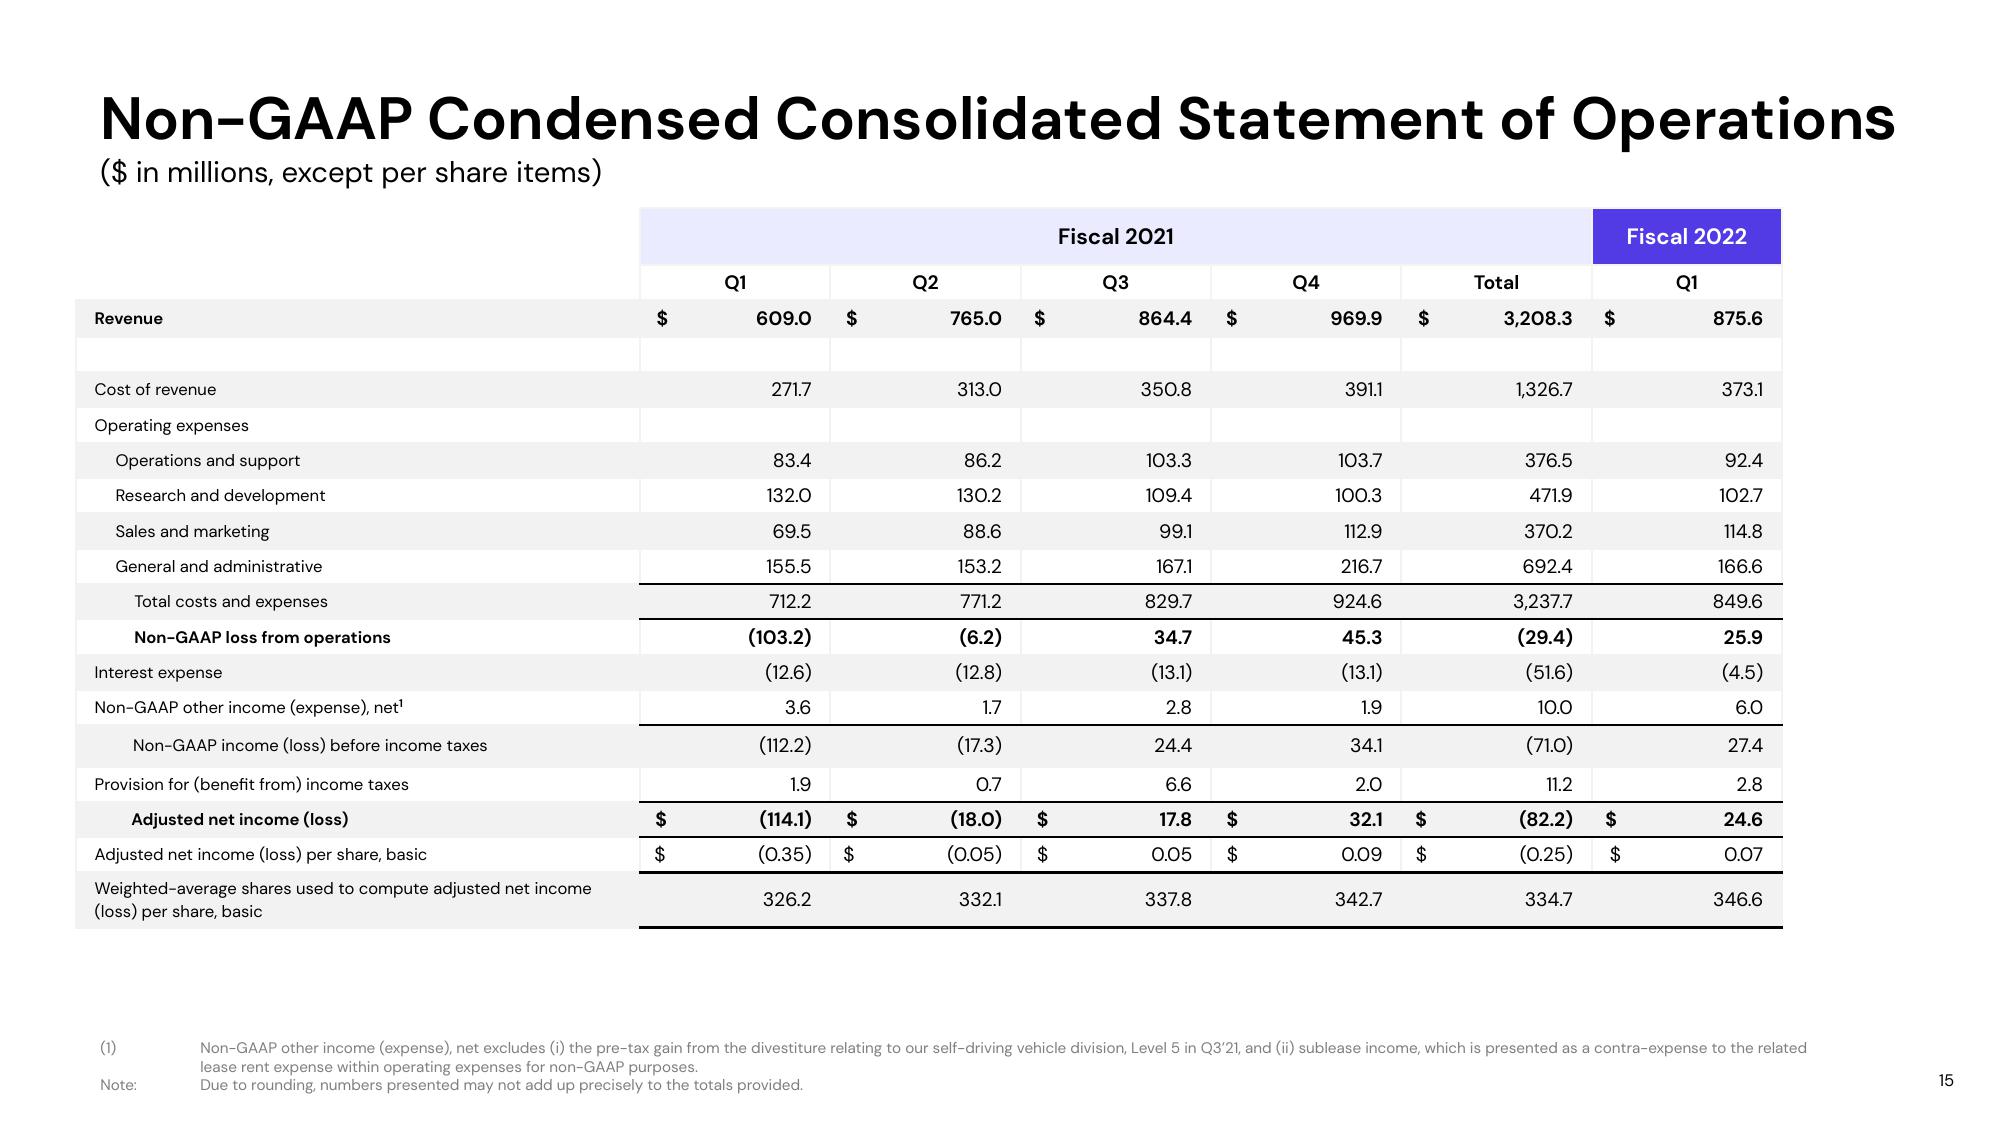
Non-GAAP Condensed Consolidated Statement of Operations
($ in millions, except per share items)
Revenue
Cost of revenue
Operating expenses
Operations and support
Research and development
Sales and marketing
General and administrative
Total costs and expenses
Non-GAAP loss from operations
Interest expense
Non-GAAP other income (expense), net¹
Non-GAAP income (loss) before income taxes
Provision for (benefit from) income taxes
Adjusted net income (loss)
Adjusted net income (loss) per share, basic
Weighted-average shares used to compute adjusted net income
(loss) per share, basic
(1)
Note:
$
$
$
Q1
609.0
271.7
$
83.4
132.0
69.5
155.5
712.2
(103.2)
(12.6)
3.6
(112.2)
1.9
(114.1) $
(0.35) $
326.2
Q2
765.0
313.0
$
86.2
130.2
88.6
153.2
771.2
(6.2)
(12.8)
1.7
(17.3)
0.7
(18.0) $
(0.05) $
332.1
Fiscal 2021
Q3
864.4
350.8
103.3
109.4
99.1
167.1
829.7
34.7
(13.1)
2.8
24.4
6.6
17.8
0.05
337.8
$
$
$
Q4
969.9
391.1
103.7
100.3
112.9
216.7
924.6
45.3
(13.1)
1.9
34.1
2.0
32.1
0.09
342.7
$
$
$
Total
3,208.3 $
1,326.7
376.5
471.9
370.2
692.4
3,237.7
(29.4)
(51.6)
10.0
(71.0)
11.2
(82.2)
(0.25)
334.7
$
$
Fiscal 2022
Q1
875.6
373.1
92.4
102.7
114.8
166.6
849.6
25.9
(4.5)
6.0
27.4
2.8
24.6
0.07
346.6
Non-GAAP other income (expense), net excludes (i) the pre-tax gain from the divestiture relating to our self-driving vehicle division, Level 5 in Q3'21, and (ii) sublease income, which is presented as a contra-expense to the related
lease rent expense within operating expenses for non-GAAP purposes.
Due to rounding, numbers presented may not add up precisely to the totals provided.
15View entire presentation