Sonos Results Presentation Deck
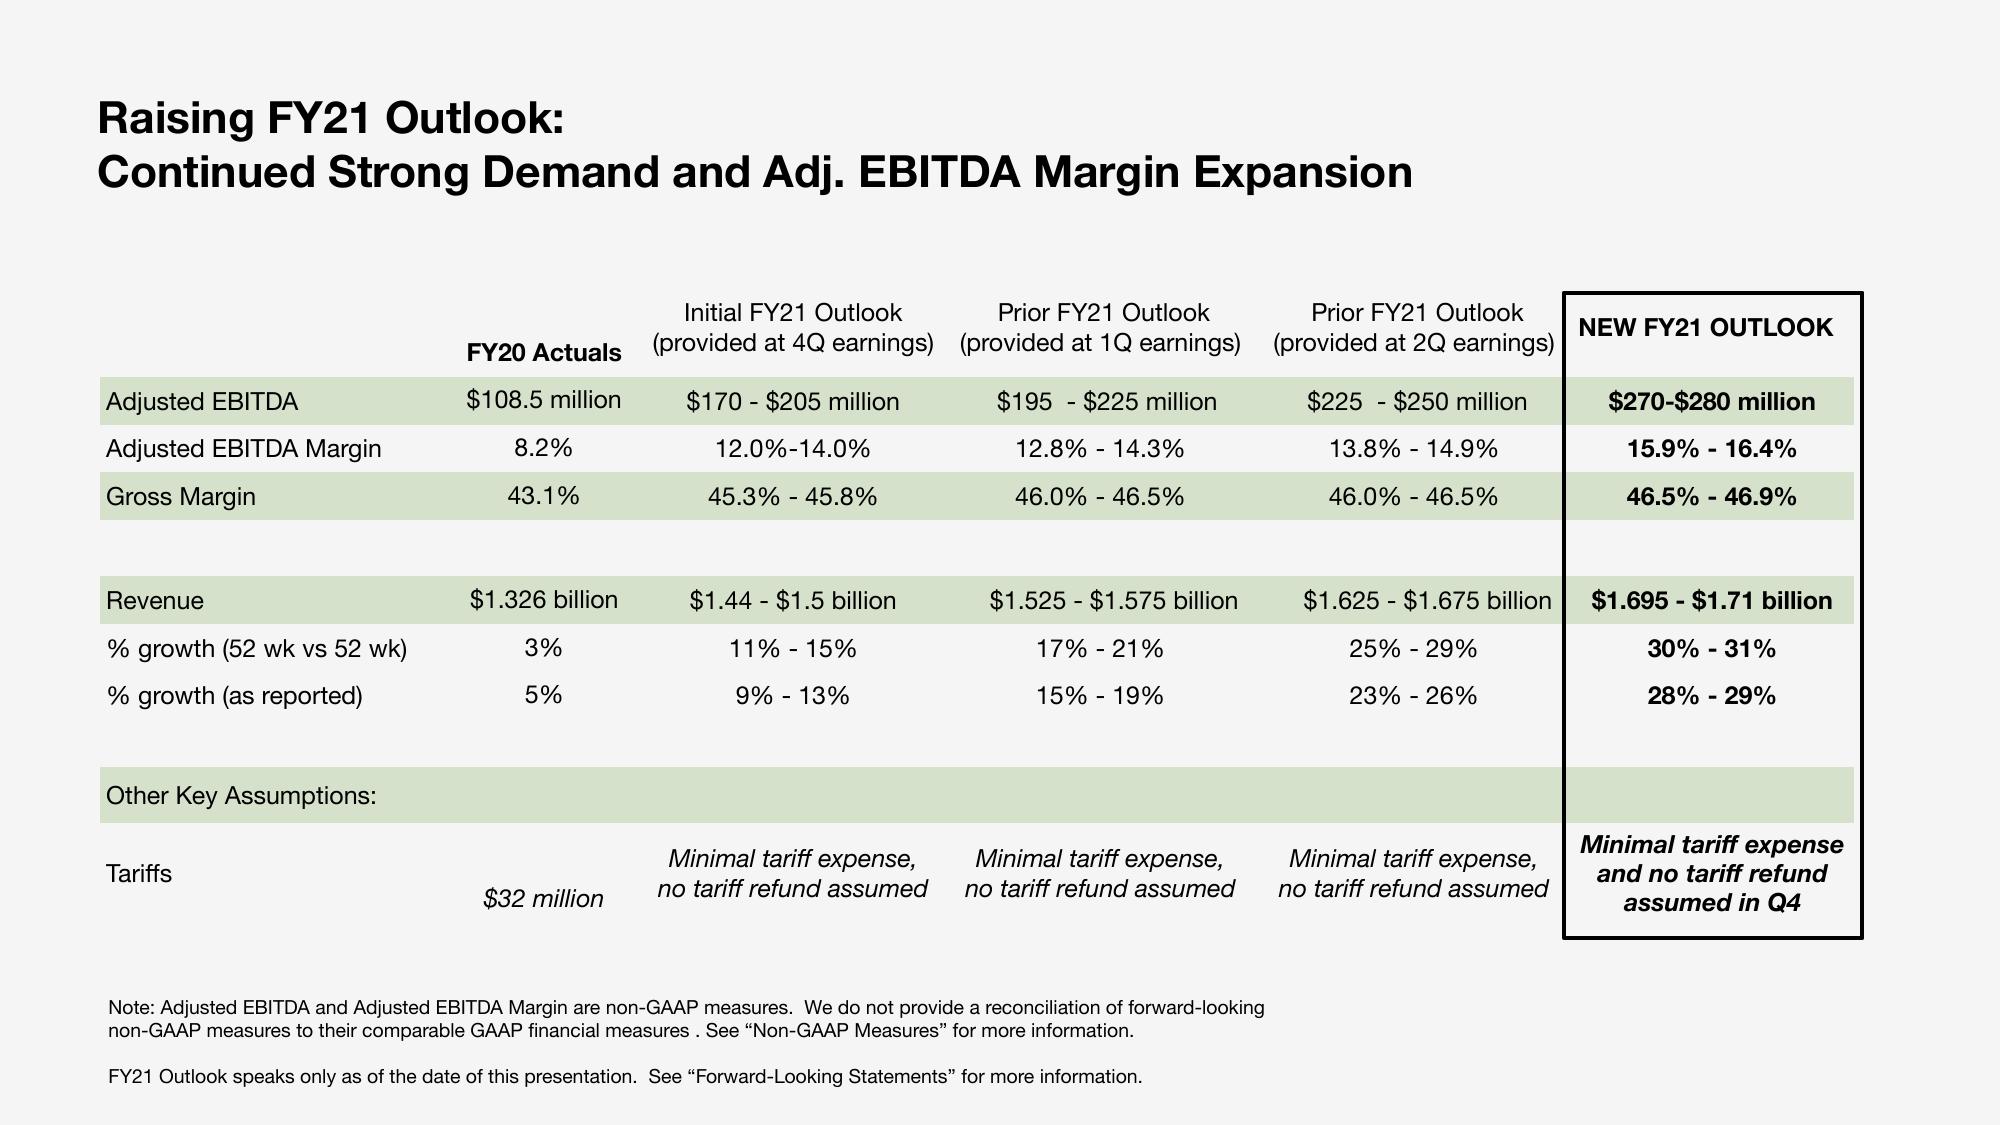
Raising FY21 Outlook:
Continued Strong Demand and Adj. EBITDA Margin Expansion
Adjusted EBITDA
Adjusted EBITDA Margin
Gross Margin
Revenue
% growth (52 wk vs 52 wk)
% growth (as reported)
Other Key Assumptions:
Tariffs
FY20 Actuals
$108.5 million
8.2%
43.1%
$1.326 billion
3%
5%
$32 million
Initial FY21 Outlook
(provided at 4Q earnings)
$170 $205 million
12.0%-14.0%
45.3% - 45.8%
$1.44 $1.5 billion
11% - 15%
9% -13%
Minimal tariff expense,
no tariff refund assumed
Prior FY21 Outlook
(provided at 1Q earnings)
$195 $225 million
12.8% 14.3%
46.0% - 46.5%
$1.525 $1.575 billion
17% -21%
15% - 19%
Minimal tariff expense,
no tariff refund assumed
Note: Adjusted EBITDA and Adjusted EBITDA Margin are non-GAAP measures. We do not provide a reconciliation of forward-looking
non-GAAP measures to their comparable GAAP financial measures. See "Non-GAAP Measures" for more information.
FY21 Outlook speaks only as of the date of this presentation. See "Forward-Looking Statements" for more information.
Prior FY21 Outlook
(provided at 2Q earnings)
$225 $250 million
13.8% 14.9%
46.0% - 46.5%
$1.625 $1.675 billion
25% -29%
23% -26%
Minimal tariff expense,
no tariff refund assumed
NEW FY21 OUTLOOK
$270-$280 million
15.9% -16.4%
46.5% 46.9%
$1.695 - $1.71 billion
30% -31%
28% -29%
Minimal tariff expense
and tariff refund
assumed in Q4View entire presentation