MSR Value Growth & Market Trends
STRONG ORIGINATIONS PROFITS AS MARGINS COMPRESS TOWARDS NORMAL
●
$438
3Q'20
Originations Pretax Operating Income (1) ($ mm's)
$435
4Q'20
$362
1Q'21
$213
2Q¹21
9 (¹) Please see appendix for reconciliations of non-GAAP items
Adverse Fee
removal
$20
$253
3Q'21
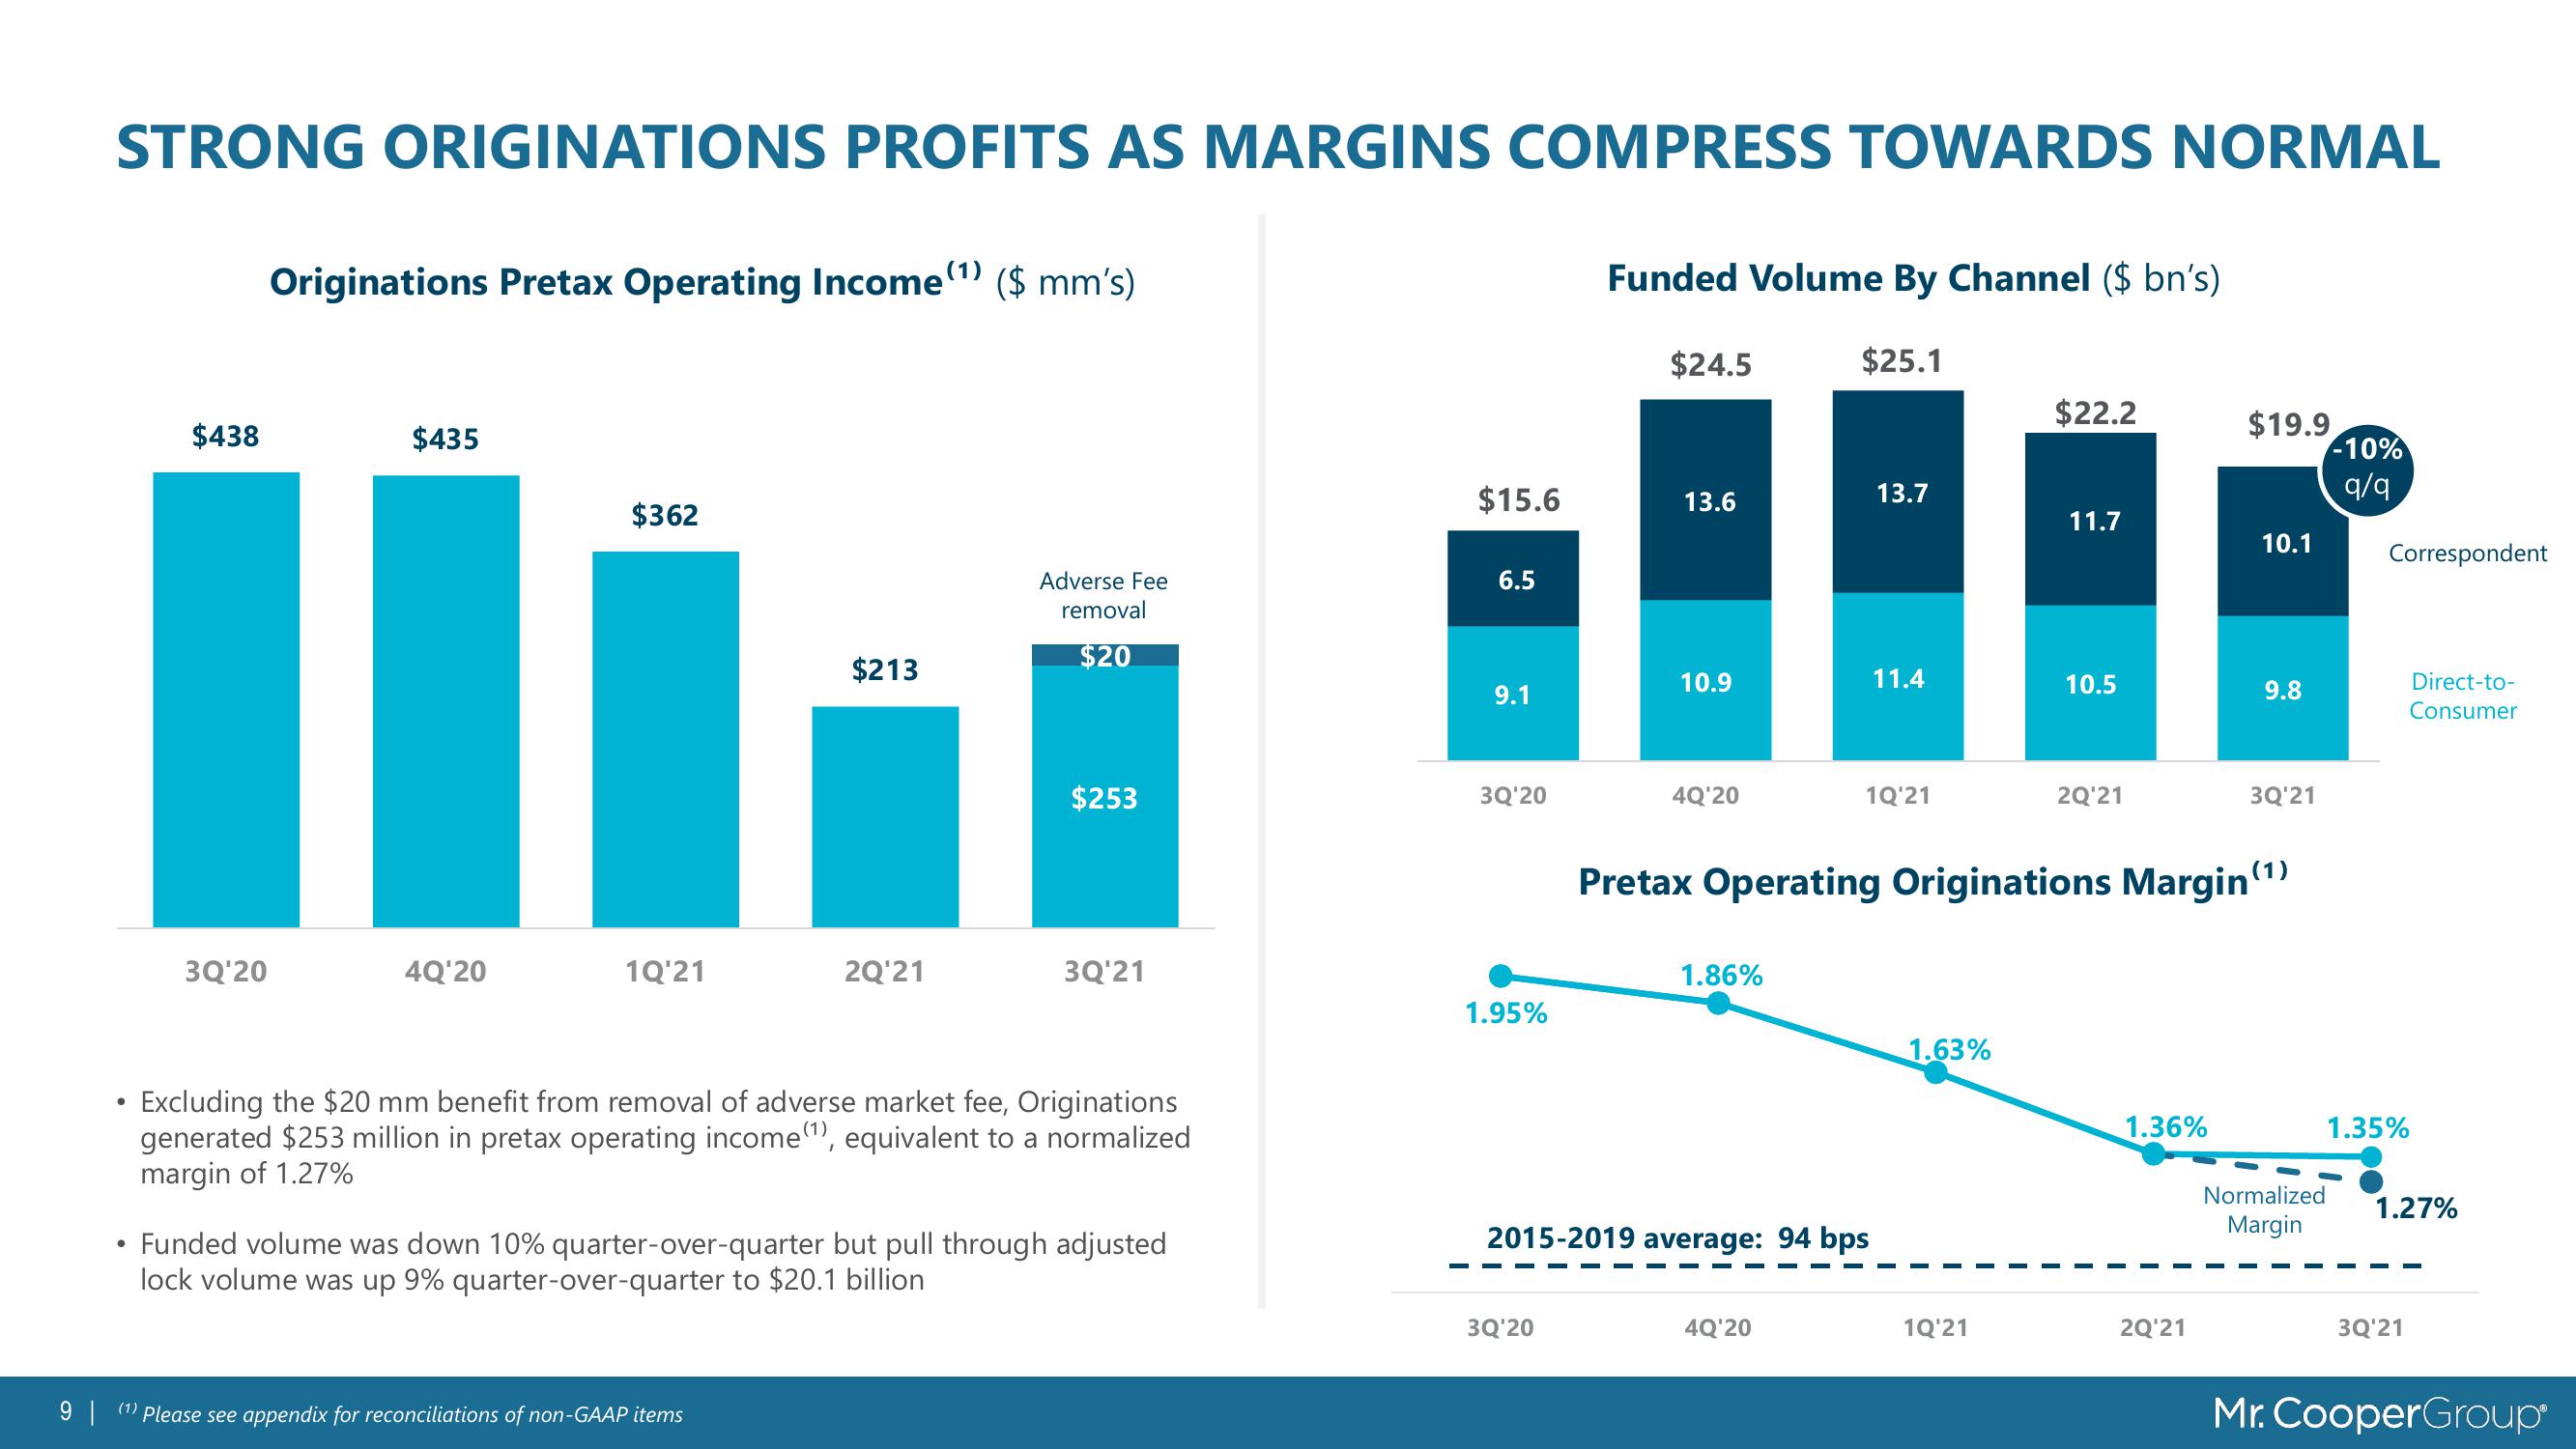
Excluding the $20 mm benefit from removal of adverse market fee, Originations
generated $253 million in pretax operating income(¹), equivalent to a normalized
margin of 1.27%
unded volume was down 10% quarter-over-quarter but pull through adjusted
lock volume was up 9% quarter-over-quarter to $20.1 billion
$15.6
6.5
9.1
3Q'20
1.95%
Funded Volume By Channel ($ bn's)
3Q'20
$24.5
13.6
10.9
4Q'20
1.86%
$25.1
2015-2019 average: 94 bps
4Q'20
13.7
11.4
1Q'21
1.63%
$22.2
1Q'21
11.7
10.5
2Q'21
Pretax Operating Originations Margin(¹)
1.36%
$19.9
2Q'21
10.1
9.8
3Q'21
Normalized
Margin
-10%
q/q
Correspondent
1.35%
Direct-to-
Consumer
1.27%
3Q'21
Mr. CooperGroupView entire presentation