Sonos Results Presentation Deck
FY24 Outlook: Balancing Investment to Drive Margin Expansion
Revenue
% (decline) / growth
constant currency
GAAP Gross Margin
Adjustments¹
Non-GAAP Gross Margin¹ 1
Adjusted EBITDA
Adjusted EBITDA Margin
FY23 Actuals
$1.655 billion
(6%)
(3%)
43.3%
0.4%
43.7%
$153.9 million
9.3%
FY24 Outlook
$1.6 to 1.7 billion
(3%) to 3%
(3%) to 3%
45.0% to 46.0%
0.4%
45.4% to 46.4%
$150-180 million
9.4% 10.6%
Key Assumptions
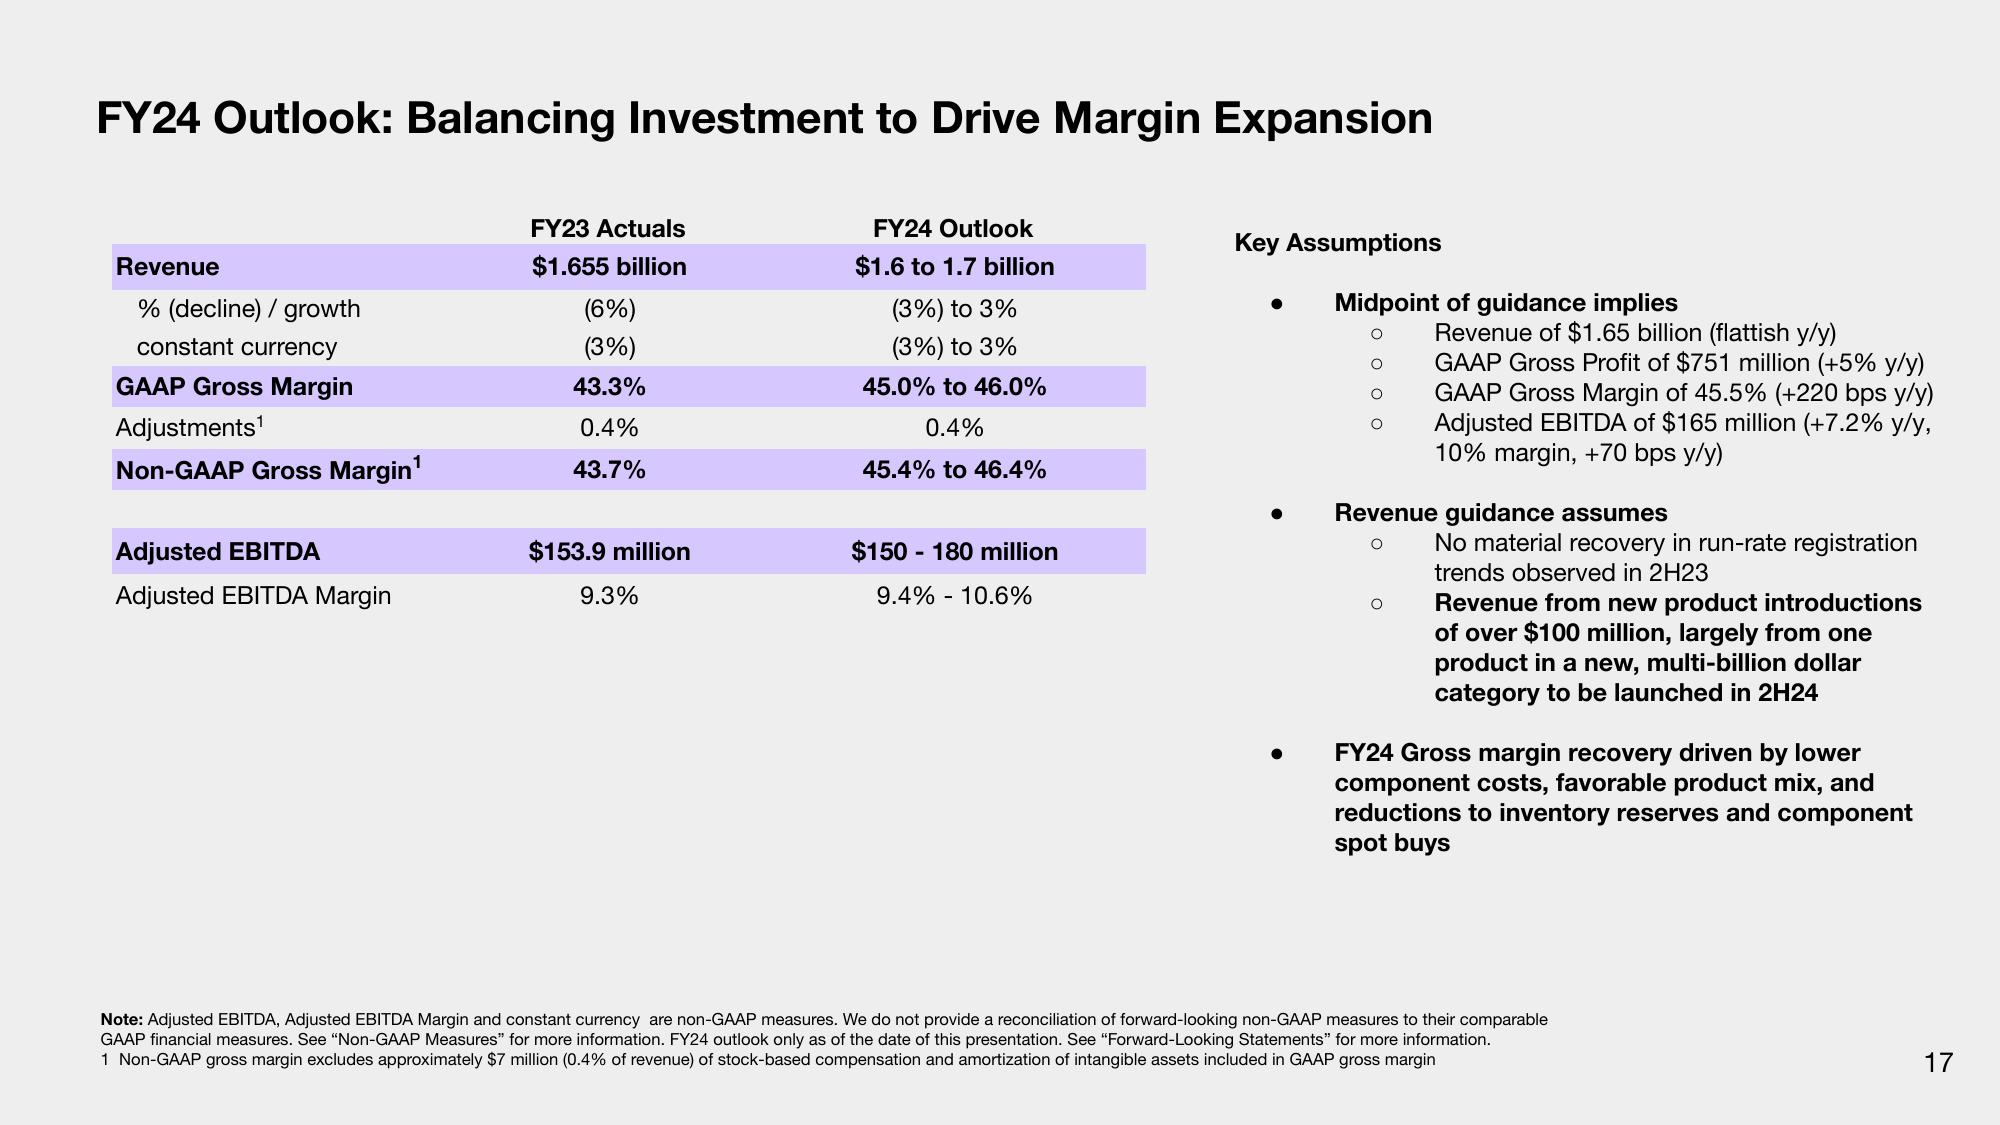
Midpoint of guidance implies
O
O
O
Revenue of $1.65 billion (flattish y/y)
GAAP Gross Profit of $751 million (+5% y/y)
O
GAAP Gross Margin of 45.5% (+220 bps y/y)
Adjusted EBITDA of $165 million (+7.2% y/y,
10% margin, +70 bps y/y)
Revenue guidance assumes
O
No material recovery in run-rate registration
trends observed in 2H23
Revenue from new product introductions
of over $100 million, largely from one
product in a new, multi-billion dollar
category to be launched in 2H24
FY24 Gross margin recovery driven by lower
component costs, favorable product mix, and
reductions to inventory reserves and component
spot buys
Note: Adjusted EBITDA, Adjusted EBITDA Margin and constant currency are non-GAAP measures. We do not provide a reconciliation of forward-looking non-GAAP measures to their comparable
GAAP financial measures. See "Non-GAAP Measures" for more information. FY24 outlook only as of the date of this presentation. See "Forward-Looking Statements" for more information.
1 Non-GAAP gross margin excludes approximately $7 million (0.4% of revenue) of stock-based compensation and amortization of intangible assets included in GAAP gross margin
17View entire presentation