Hanmi Financial Results Presentation Deck
($ in millions)
Average assets
Net interest revenue
Noninterest income
Noninterest expense
PTPP
Noninterest income
less gain on a branch sale-and-leaseback
Adjusted noninterest income
PTPP
less gain on a branch sale-and-leaseback
Adjusted PTPP
PTPP/Average assets
Adjusted PTPP/Average assets
Note: numbers may not add due to rounding
H Hanmi Financial Corporation
December 31, 2023
7,475.2
$
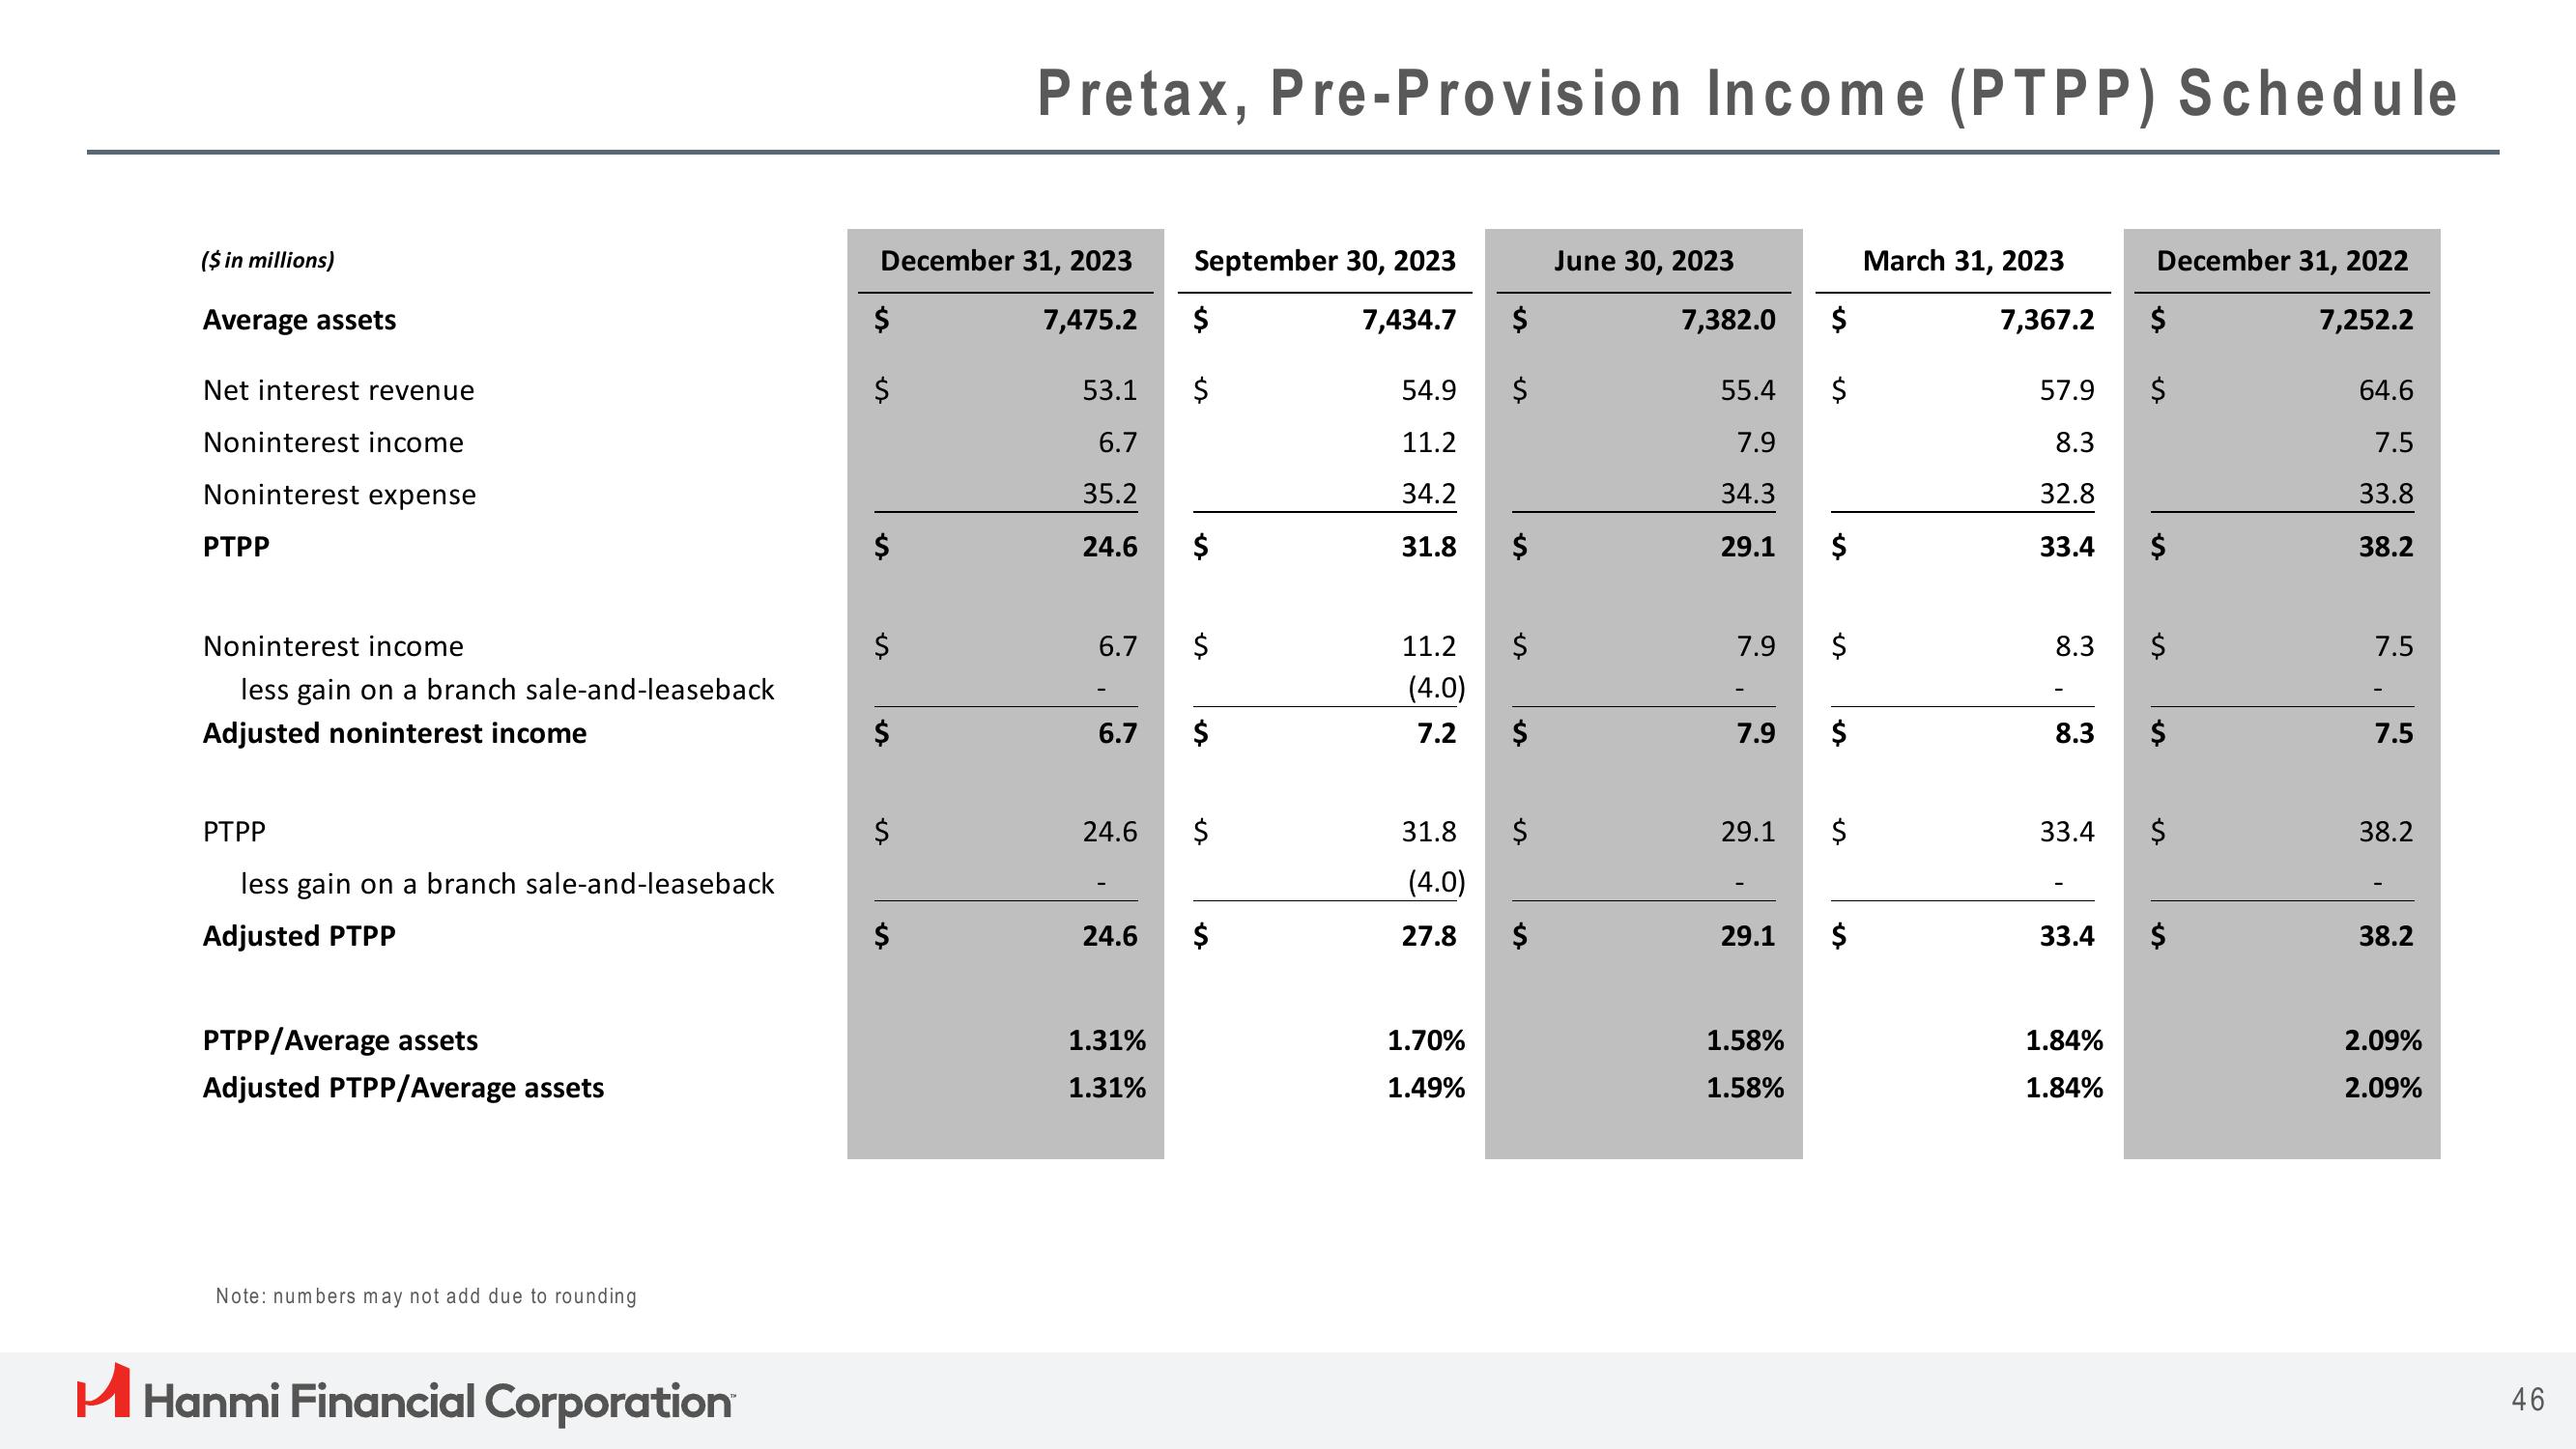
Pretax, Pre-Provision Income (PTPP) Schedule
$
53.1
6.7
35.2
24.6
6.7
6.7
24.6
24.6
1.31%
1.31%
September 30, 2023
7,434.7
$
$
$
$
$
$
$
54.9
11.2
34.2
31.8
11.2
(4.0)
7.2
31.8
(4.0)
27.8
1.70%
1.49%
$
$
$
$
$
$
$
June 30, 2023
7,382.0
55.4
7.9
34.3
29.1
7.9
7.9
29.1
29.1
1.58%
1.58%
$
$
$
$
March 31, 2023
7,367.2
57.9
8.3
32.8
33.4
8.3
8.3
33.4
December 31, 2022
7,252.2
1.84%
1.84%
$
$
$
$
33.4 $
$
$
64.6
7.5
33.8
38.2
7.5
7.5
38.2
38.2
2.09%
2.09%
46View entire presentation