Maersk Results Presentation Deck
Maersk Group
- Interim Report 03 2015
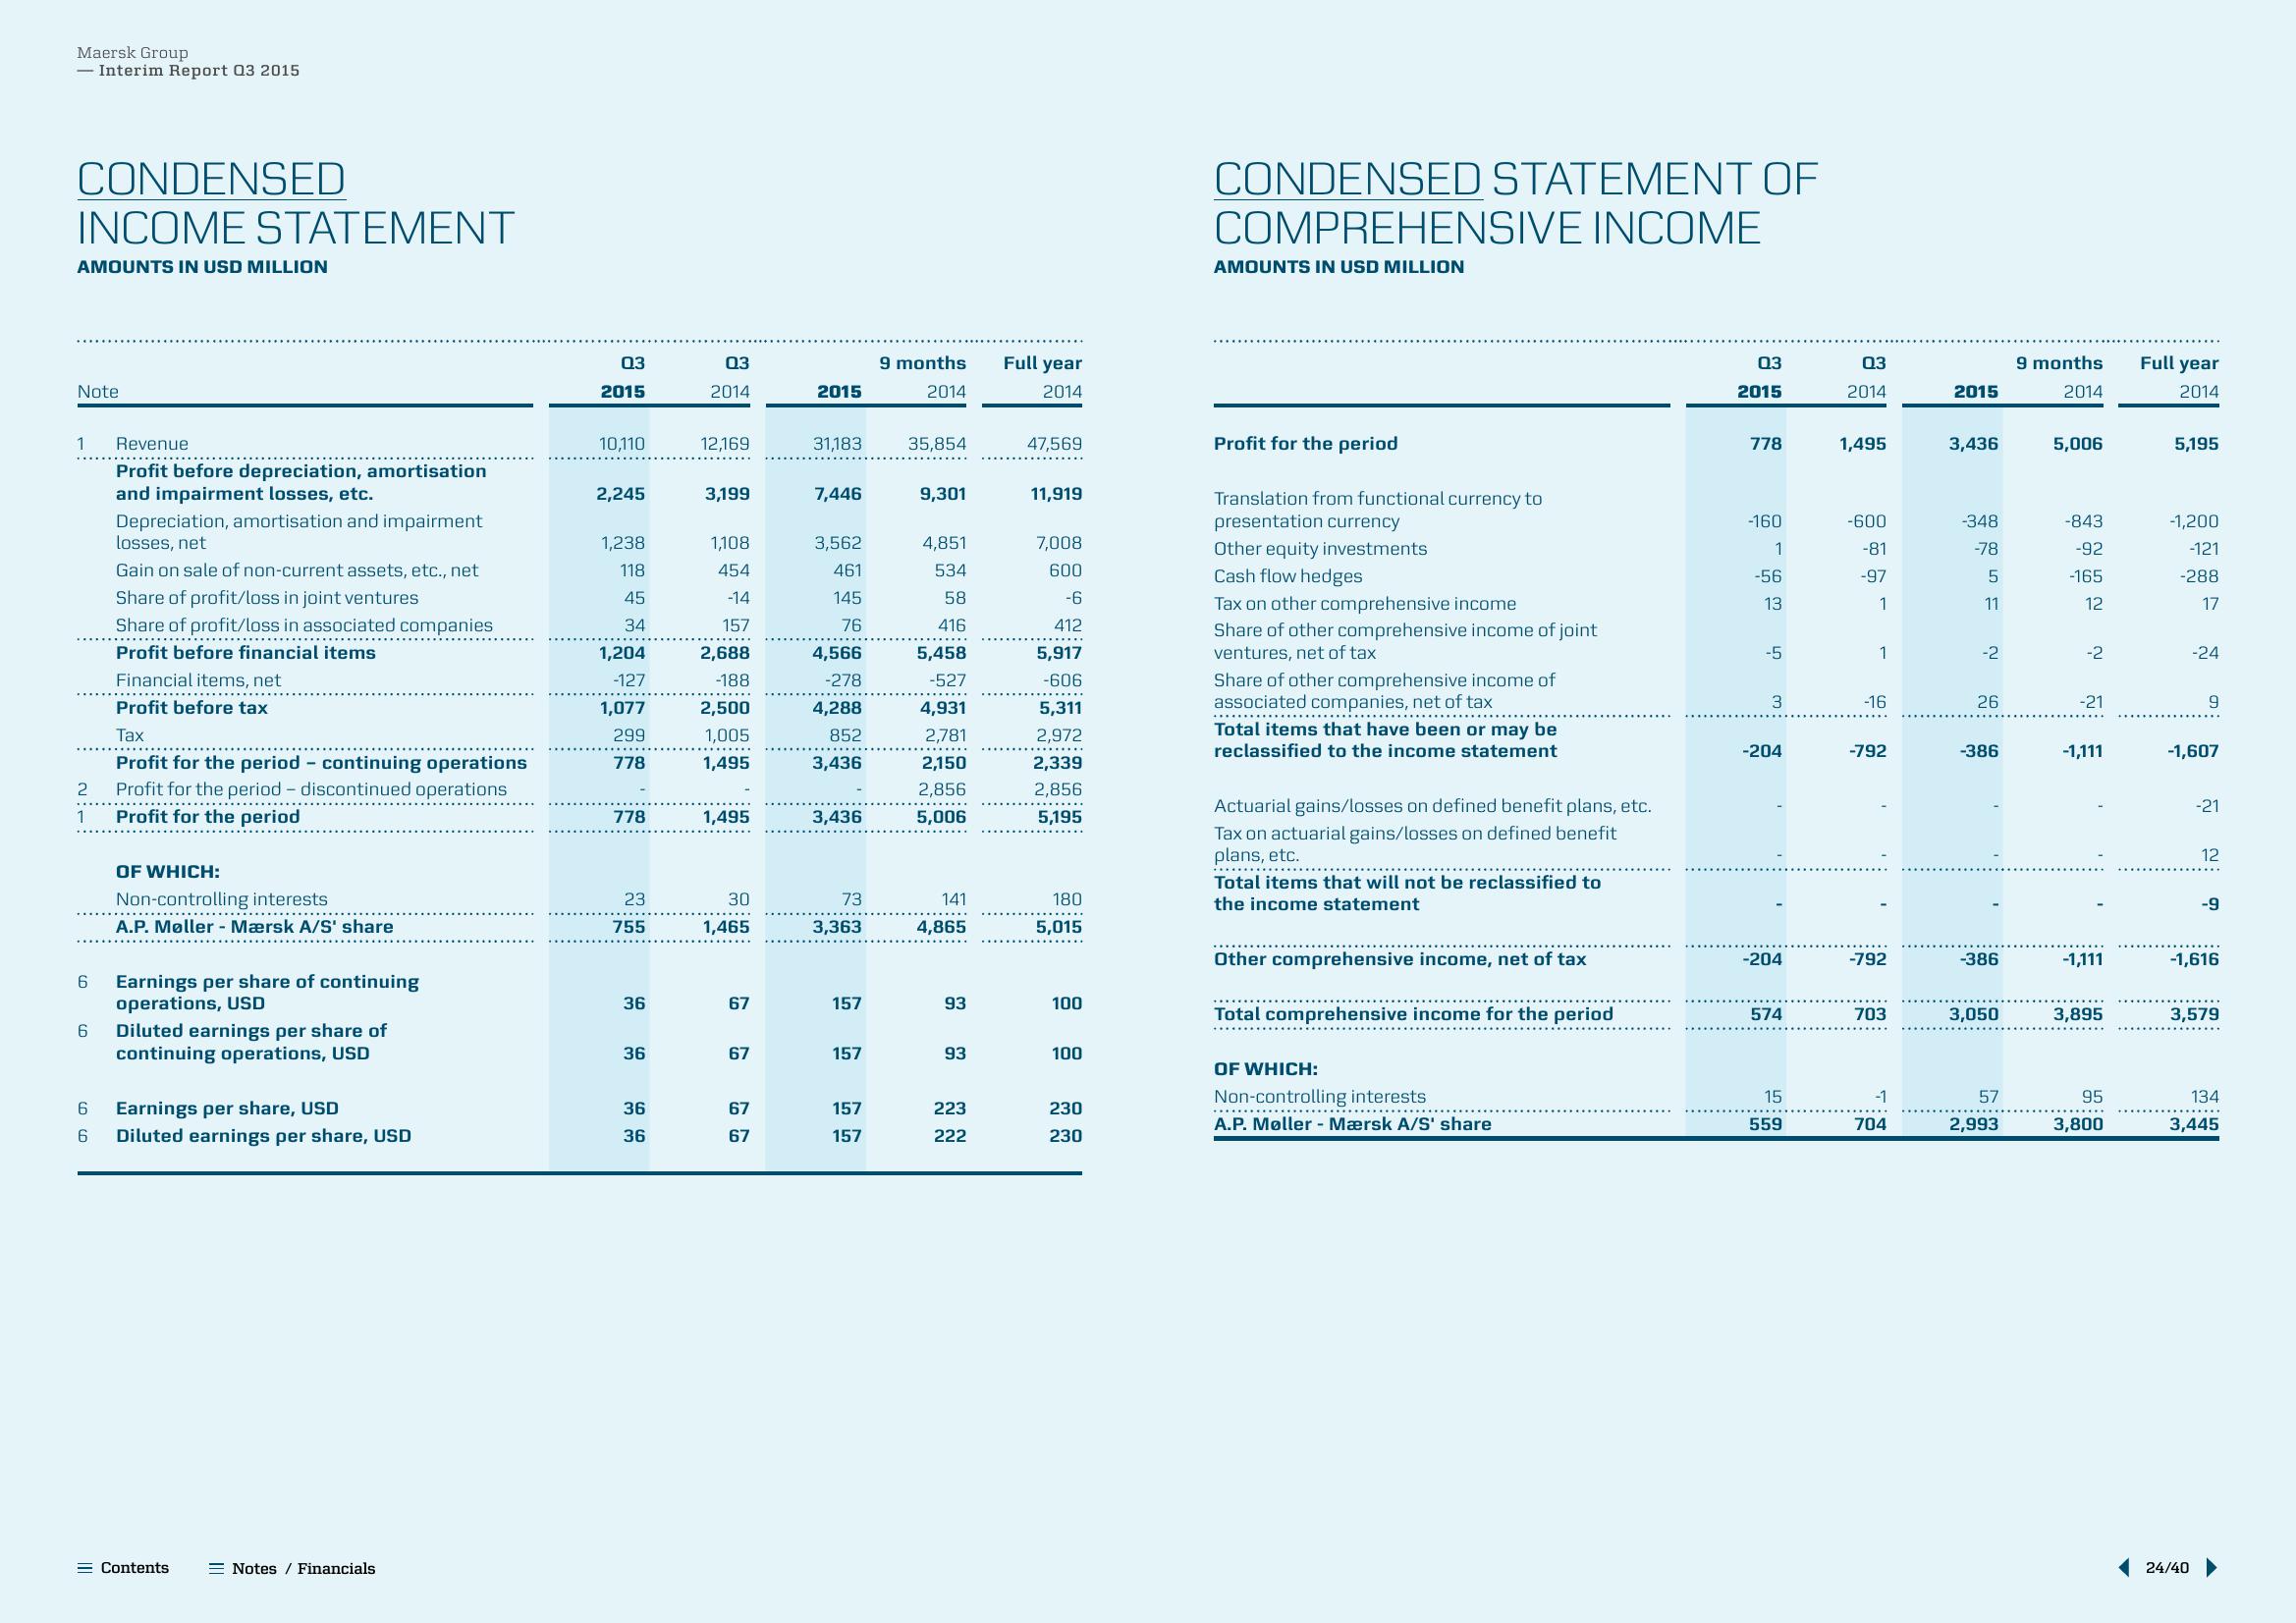
CONDENSED
INCOME STATEMENT
AMOUNTS IN USD MILLION
Note
1
2
1
6
Revenue
Profit before depreciation, amortisation
and impairment losses, etc.
Depreciation, amortisation and impairment
losses, net
6
6
Gain on sale of non-current assets, etc., net
Share of profit/loss in joint ventures
Share of profit/loss in associated companies
Profit before financial items
Financial items, net
Profit before tax
Tax
Profit for the period - continuing operations
Profit for the period - discontinued operations
Profit for the period
OF WHICH:
Non-controlling interests
A.P. Møller-Mærsk A/S' share
Earnings per share of continuing
operations, USD
6 Diluted earnings per share of
continuing operations, USD
Earnings per share, USD
Diluted earnings per share, USD
= Contents
Notes / Financials
03
2015
10,110
2,245
1,238
118
45
34
1,204
-127
1,077
299
778
778
23
755
36
36
36
36
0.3
2014
12,169
3,199
1,108
454
-14
157
2,688
-188
2,500
1,005
1,495
1,495
30
1,465
67
67
67
67
2015
31,183
7,446
3,562
461
145
76
4,566
-278
4,288
852
3,436
3,436
73
3,363
157
157
157
157
9 months
2014
35,854
9,301
4,851
534
58
416
5,458
-527
4,931
2,781
2,150
2,856
5,006
141
4,865
93
93
223
222
Full year
2014
47,569
11,919
7,008
600
-6
412
5,917
-606
5,311
2,972
2,339
2,856
5,195
180
5,015
100
100
230
230
CONDENSED STATEMENT OF
COMPREHENSIVE INCOME
AMOUNTS IN USD MILLION
Profit for the period
Translation from functional currency to
presentation currency
Other equity investments
Cash flow hedges
Tax on other comprehensive income
Share of other comprehensive income of joint
ventures, net of tax
Share of other comprehensive income of
associated companies, net of tax
***********
Total items that have been or may be
reclassified to the income statement
.…..….….…......
Actuarial gains/losses on defined benefit plans, etc.
Tax on actuarial gains/losses on defined benefit
plans, etc.
*********..
Total items that will not be reclassified to
the income statement
Other comprehensive income, net of tax
Total comprehensive income for the period
OF WHICH:
Non-controlling interests
...….....………………..
A.P. Møller-Mærsk A/S' share
03
2015
778
-160
1
-56
13
-5
3
-204
-204
574
15
559
03
2014
1,495
-600
-81
-97
1
1
-16
-792
-792
703
-1
704
2015
3,436
-348
-78
5
11
-2
26
-386
-386
3,050
57
2,993
9 months
2014
5,006
-843
-92
-165
12
-2
-21
-1,111
-1,111
3,895
95
3,800
Full year
2014
5,195
-1,200
-121
-288
17
-24
9
-1,607
-21
24/40
12
60
-1,616
3,579
134
3,445View entire presentation