Credit Suisse Investment Banking Pitch Book
CONFIDENTIAL
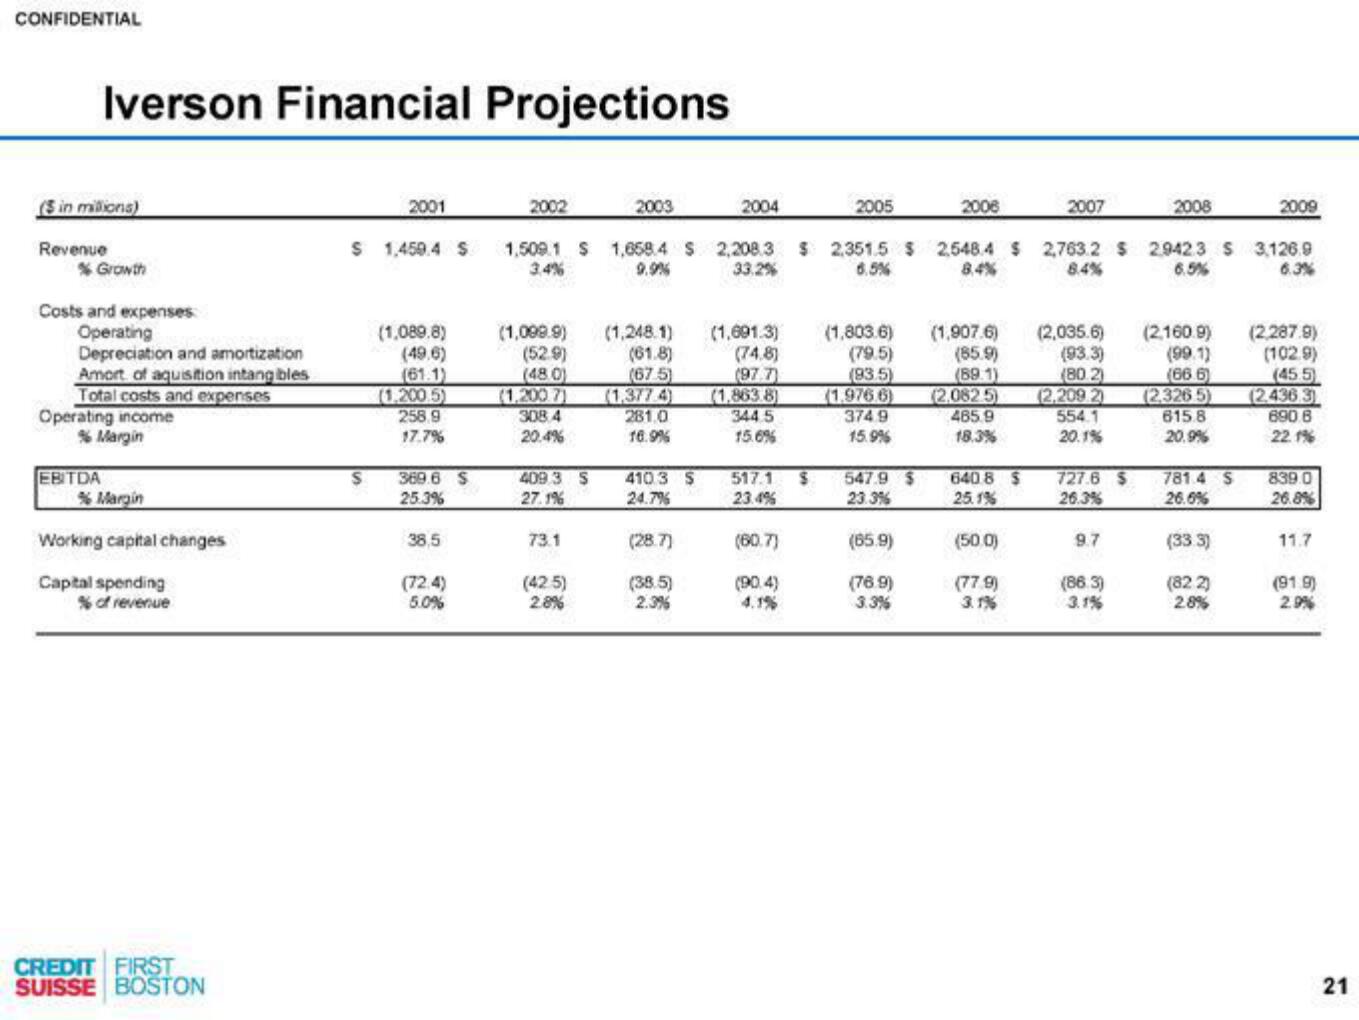
Iverson Financial Projections
(in millions)
Revenue
% Growth
Costs and expenses
Operating
Depreciation and amortization
Amort of aquisition intangibles
Total costs and expenses
Operating income
% Margin
EBITDA
% Margin
Working capital changes
Capital spending
% of revenue
CREDIT FIRST
SUISSE BOSTON
2001
$ 1,450.4 S
(1,089.8)
(49.6)
(61.1)
(1,200.5)
258.9
17.7%
S 369.6 S
25.3%
38.5
(72.4)
5.0%
2002
(1,099.9) (1,248.1)
(52.9)
(61.8)
(480)
(67.5)
(1,200.7)
308 4
20.4%
409 3 S
27.1%
2003
73.1
(42.5)
2.8%
1,509.1 S 1,658.4 $ 2,208.3 $ 2,351.5 $ 2548.4 $ 2,763.2 $ 29423 S 3,126.9
3.4%
33.2%
6.5%
8.4%
9.9%
8.4%
6.5%
6.3%
(1,377.4)
281.0
16.9%
410 3 S
24.7%
2004
(28.7)
(38.5)
2.3%
(1,691.3)
(74.8)
(97.7)
(1.863.8)
344.5
15.6%
517.1
23.4%
2005
(60.7)
(90.4)
4.1%
2006
(1,803.6) (1,907.6)
(79.5)
(65.9)
(93.5)
(69.1)
(1.976.6) (2,0825)
374.9
15.9%
465.9
18.3%
S. 547.9 $
23.3%
(65.9)
(76.9)
3.3%
2007
640.8 $
25.1%
(50.0)
(779)
3.1%
(2,035.6)
(93.3)
(80.2)
(2,209 2)
554.1
20.1%
2008
9.7
727.6 $ 781.4 S
26.3%
26.6%
(86.3)
3.1%
(2,160.9)
(99.1)
(66.6)
(2.326.5)
615.8
20.9%
2009
(33.3)
(822)
2.8%
(2.287.9)
(102.9)
(45.5)
(2.436.3)
690.6
22.1%
839.0
26.8%
11.7
(91.9)
2.9%
21View entire presentation