Kinnevik Results Presentation Deck
Intro
Net Asset Value
Note 4 Financial Assets Accounted at
Fair Value Through Profit & Loss
OUR FRAMEWORK AND PRINCIPLES
In assessing the fair value of our unlisted investments, we apply IFRS
13 and the International Private Equity and Venture Capital Valuation
Guidelines, whereunder we make a collective assessment to establish
the valuation methods and points of reference that are suitable and rel-
evant in determining the fair value of each of our unlisted investments.
Valuations in recent transactions are not applied as a valuation method,
but typically provides important points of reference for our valuations.
When applicable, consideration is taken to preferential rights such as
liquidation preferences to proceeds in a sale or listing of a business.
Valuation methods include revenue, GMV, and profit multiples, with
consideration to differences in size, growth, profitability and cost of equity
capital. We also consider the strength of a company's financial position,
cash runway, and the funding environment.
The valuation process is led independently from the investment team.
Accuracy and reliability of financial information is ensured through con-
tinuous contacts with investee management teams and regular reviews
of their financial and operational reporting. Information and opinions on
applicable valuation methods are obtained periodically from investment
managers and well-renowned investment banks and audit firms. The val-
uations are approved by Kinnevik's CFO and CEO after which a proposal
is presented and discussed with the Audit & Sustainability Committee and
Kinnevik's external auditors. After their scrutiny and potential adjustments,
the valuations are approved by the Audit & Sustainability Committee and
included in Kinnevik's financial reports.
When establishing the fair value of other financial instruments, meth-
ods assumed to provide the best estimation of fair value are used. For
assets and liabilities maturing within one year, a nominal value adjusted
for interest payments and premiums is assumed to provide a good
approximation of fair value.
Information in this note is provided per class of financial instruments
that are valued at fair value in the balance sheet, distributed in the levels
stated below:
KINNEVIK
Interim Report Q1 2022
Portfolio Overview
Category
• Value-Based Care
• Virtual Care
• Platforms & Marketplaces
• Software
• Consumer Finance
Sustainability
2021
Kinnevik Unlisted Investee Averages
Revenue Growth
+105-125%
+215-235%
+40-60% / +140-160%
+130-150%
+30-50%
Note: Kinnevik unlisted investee averages are weighted by fair value.
2021
Gross Margin
5-15%
35-55%
30-40% / 60-80%
60-80%
50-70%
Financial Statements
2022
EV/Revenue
Level 1: Fair value established based on listed prices in an active
market for the same instrument.
Level 2: Fair value established based on valuation techniques with
observable market data, either directly (as a price) or indirectly (derived
from a price) and not included in Level 1.
Level 3: Fair value established using valuation techniques, with sig-
nificant input from data that is not observable in the market.
For companies that are valued based on multiples, an increase in
the multiple by 10% would have increased the assessed fair value by
SEK 2,363m. Similarly, a decrease in the multiple by 10% would have
decreased the assessed fair value by SEK 2,586m.
LIQUIDATION PREFERENCES
Kinnevik's unlisted investee companies adopt different financing struc-
tures and may at times issue shares with liquidation preference rights.
Liquidation preferences determine how value is allocated between
shareholders in e.g. a sale or listing of a business. This allocation may
become increasingly complex over time, and Kinnevik's share of proceeds
may significantly deviate from its percentage ownership of the investee
company's issued equity. Accordingly, an increase or decrease in val-
ue of an investee company's equity where liquidation preferences are
applicable may result in a disproportionate increase or decrease in the
fair value of Kinnevik's shareholding. Liquidation preferences may also
5.5-7.5x
17.5-20x
1-3x/6-8x
30-40x
8-10x
2021
Revenue Growth
+55%
+80%
+40% / 45%
+35%
+40%
Other
Peer Group Averages
2021
Gross Margin
25%
45%
40% / 80%
80%
55%
2022
EV/Revenue
3.0x
3.5x
1-3x/6x
11.5x
8x
entail that the fair value of Kinnevik's investment remains unchanged in
spite of the assessed value of a particular investee company as a whole
changing materially.
An unlisted investee company's transition into a publicly listed com-
pany may also affect the value of Kinnevik's shareholding due to the
dismantling or triggering of such provisions.
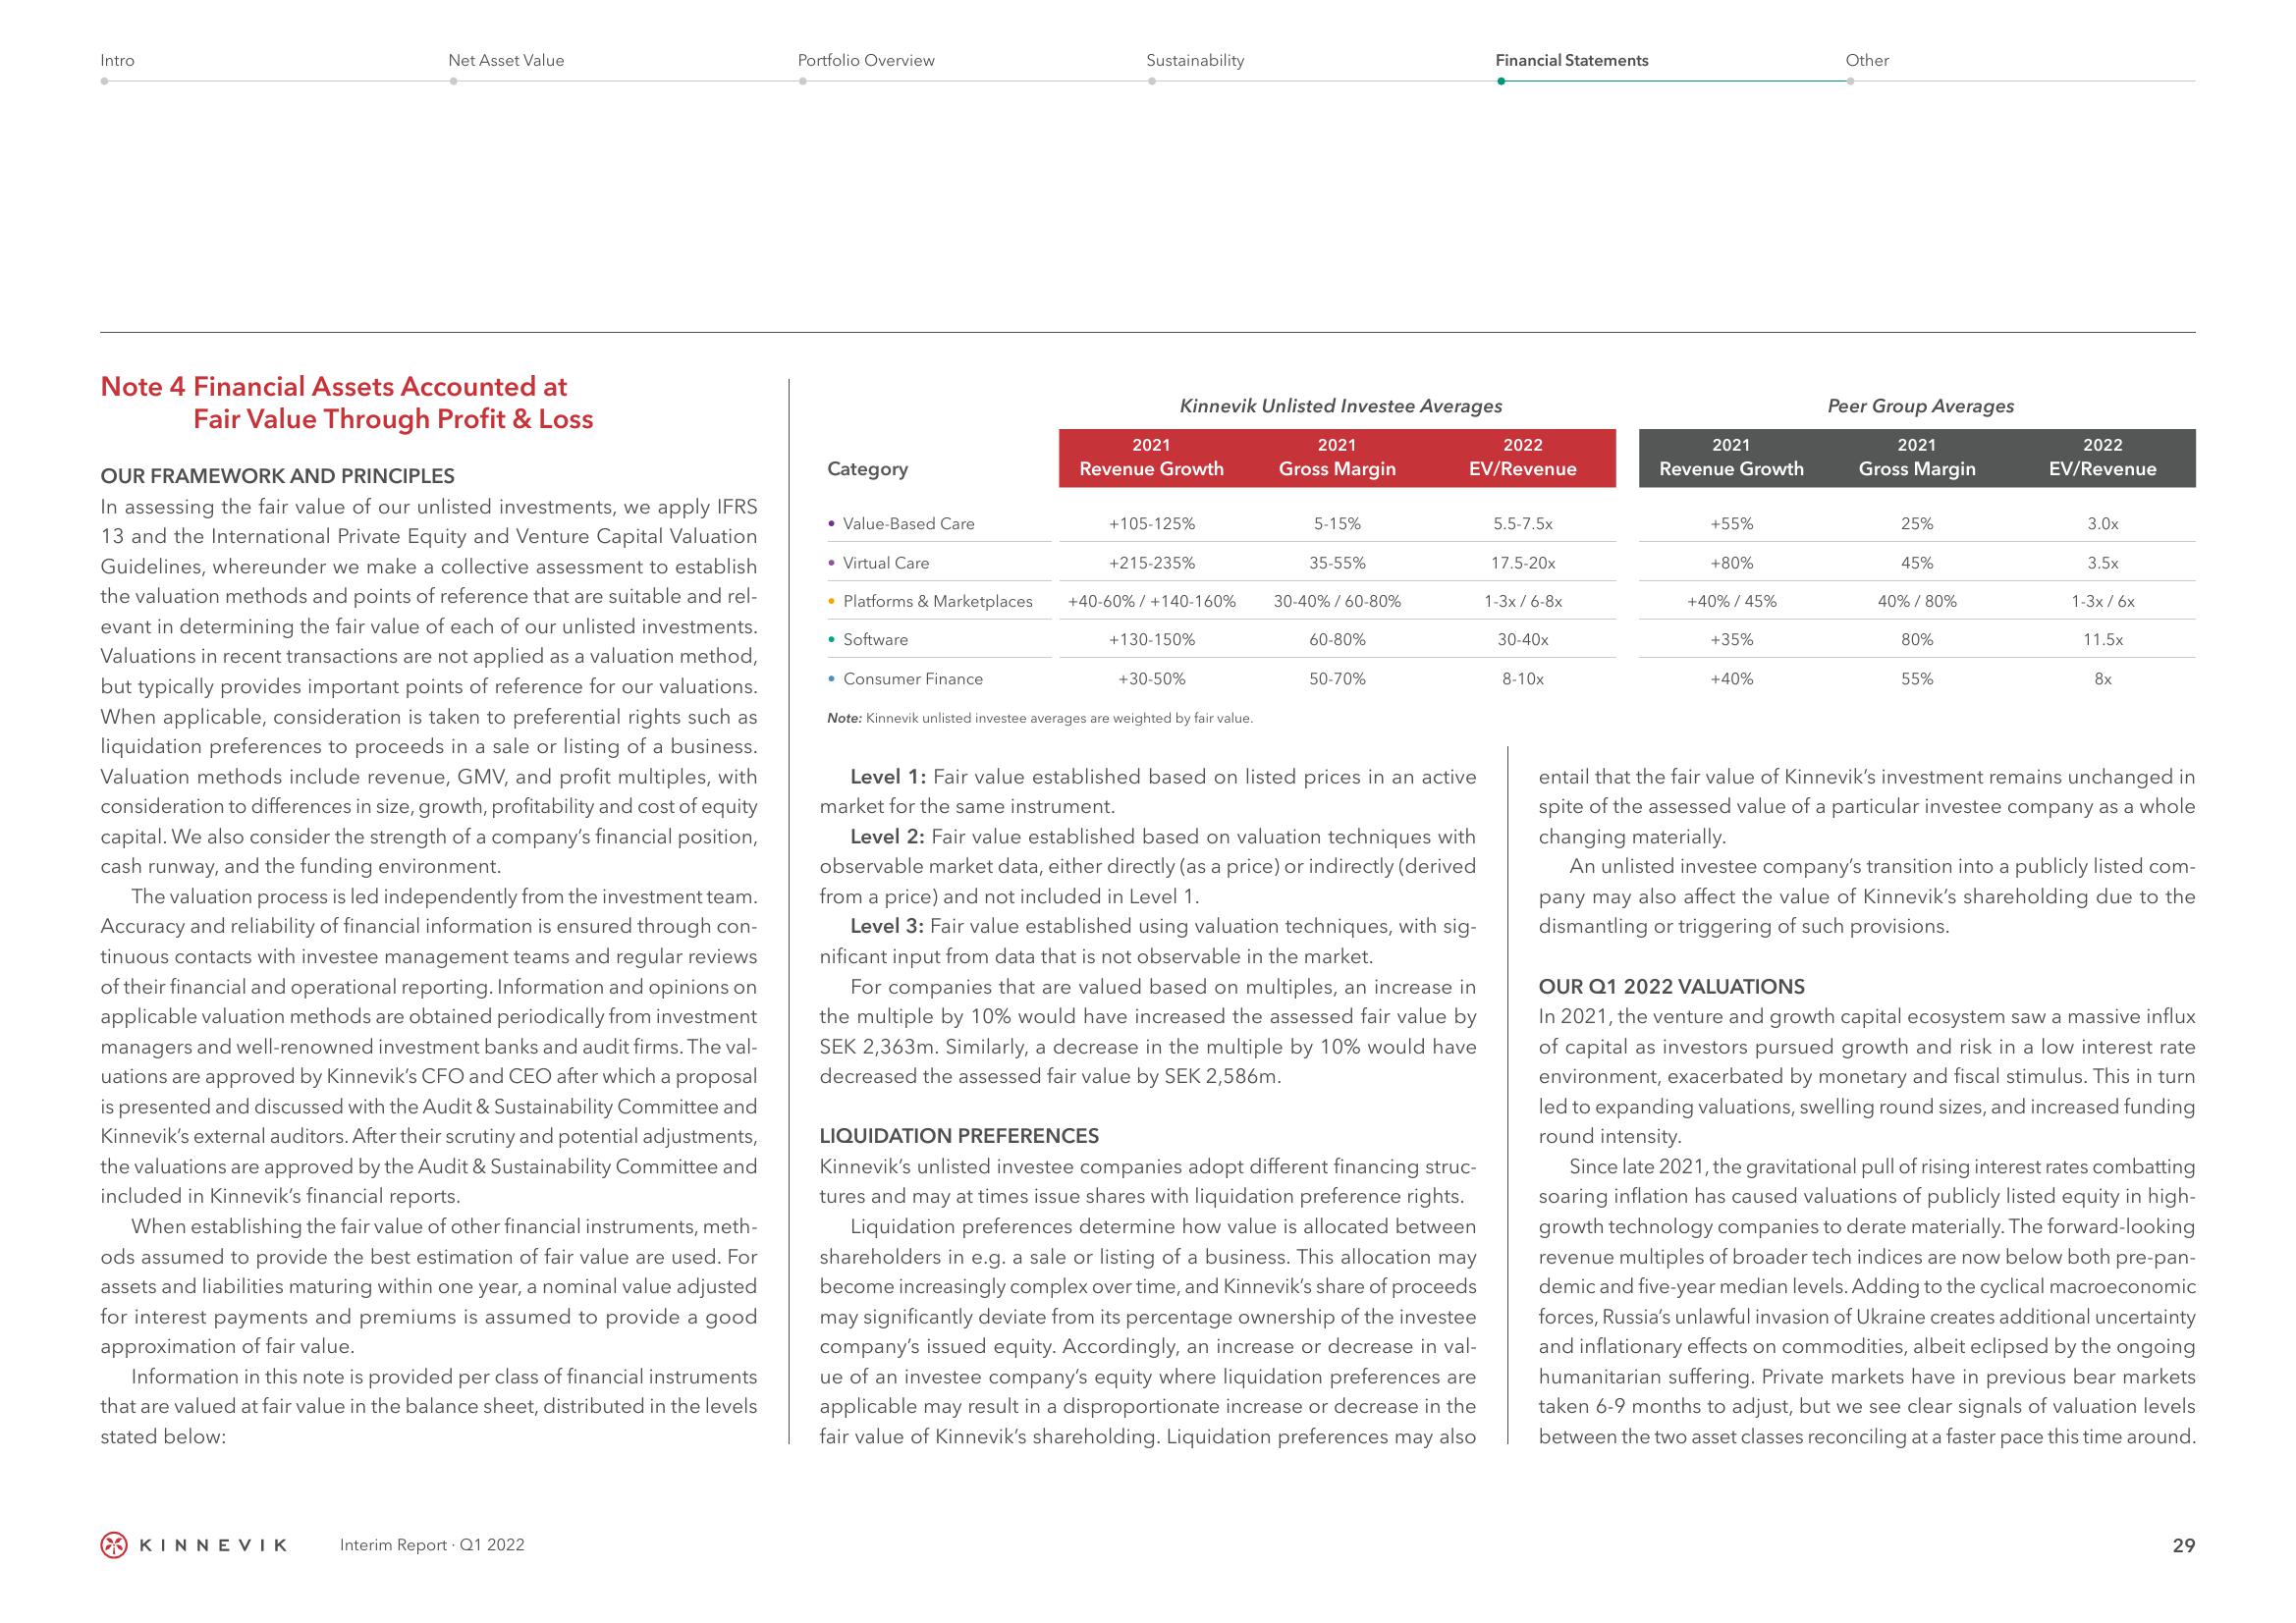
OUR Q1 2022 VALUATIONS
In 2021, the venture and growth capital ecosystem saw a massive influx
of capital as investors pursued growth and risk in a low interest rate
environment, exacerbated by monetary and fiscal stimulus. This in turn
led to expanding valuations, swelling round sizes, and increased funding
round intensity.
Since late 2021, the gravitational pull of rising interest rates combatting
soaring inflation has caused valuations of publicly listed equity in high-
growth technology companies to derate materially. The forward-looking
revenue multiples of broader tech indices are now below both pre-pan-
demic and five-year median levels. Adding to the cyclical macroeconomic
forces, Russia's unlawful invasion of Ukraine creates additional uncertainty
and inflationary effects on commodities, albeit eclipsed by the ongoing
humanitarian suffering. Private markets have in previous bear markets
taken 6-9 months to adjust, but we see clear signals of valuation levels
between the two asset classes reconciling at a faster pace this time around.
29View entire presentation