Grab Results Presentation Deck
Deliveries
More efficient incentive spend relative to peers
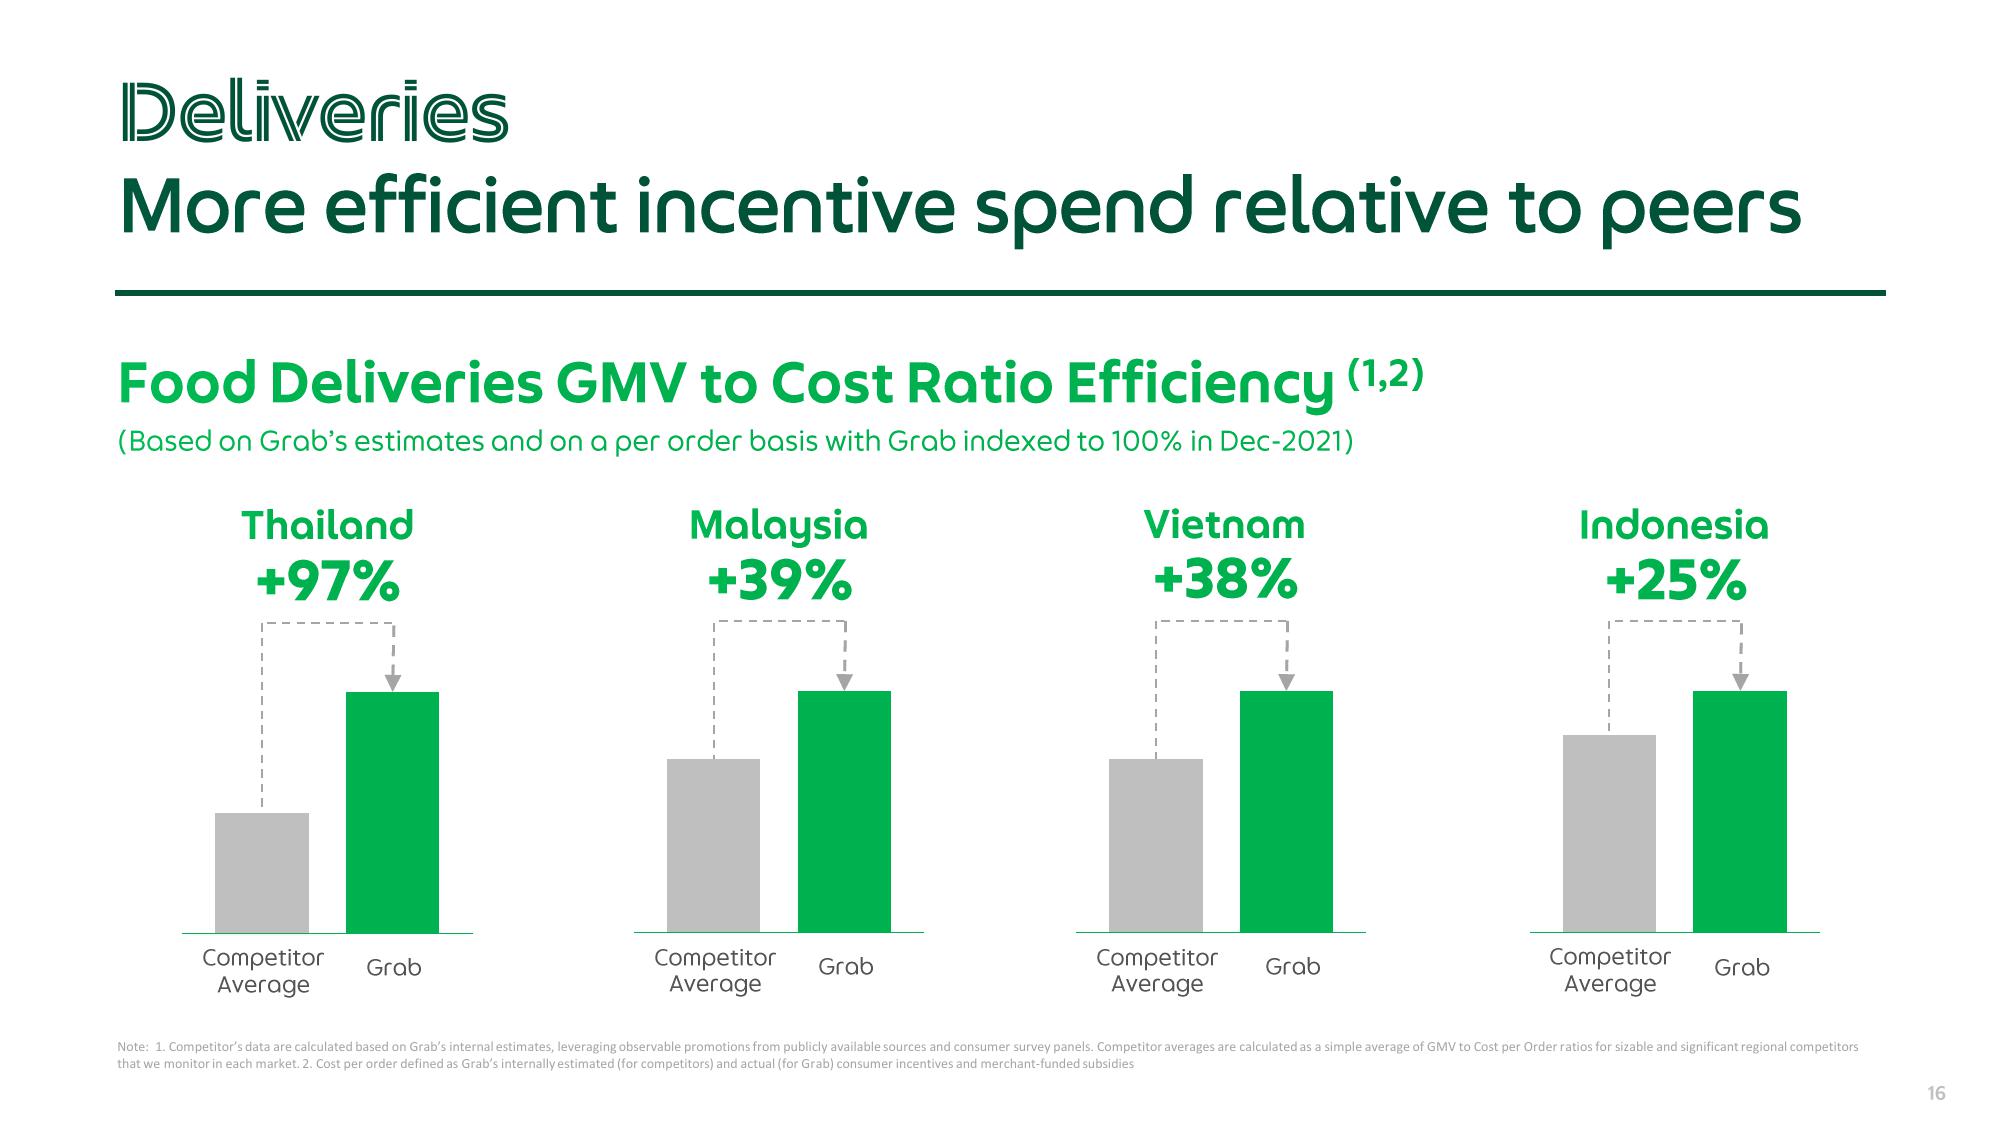
Food Deliveries GMV to Cost Ratio Efficiency (1,2)
(Based on Grab's estimates and on a per order basis with Grab indexed to 100% in Dec-2021)
Thailand
+97%
Competitor
Average
Grab
Malaysia
+39%
Competitor Grab
Average
Vietnam
+38%
Competitor
Average
Grab
Indonesia
+25%
Competitor
Average
Grab
Note: 1. Competitor's data are calculated based on Grab's internal estimates, leveraging observable promotions from publicly available sources and consumer survey panels. Competitor averages are calculated as a simple average of GMV to Cost per Order ratios for sizable and significant regional competitors
that we monitor in each market. 2. Cost per order defined as Grab's internally estimated (for competitors) and actual (for Grab) consumer incentives and merchant-funded subsidies
16View entire presentation