Bed Bath & Beyond Results Presentation Deck
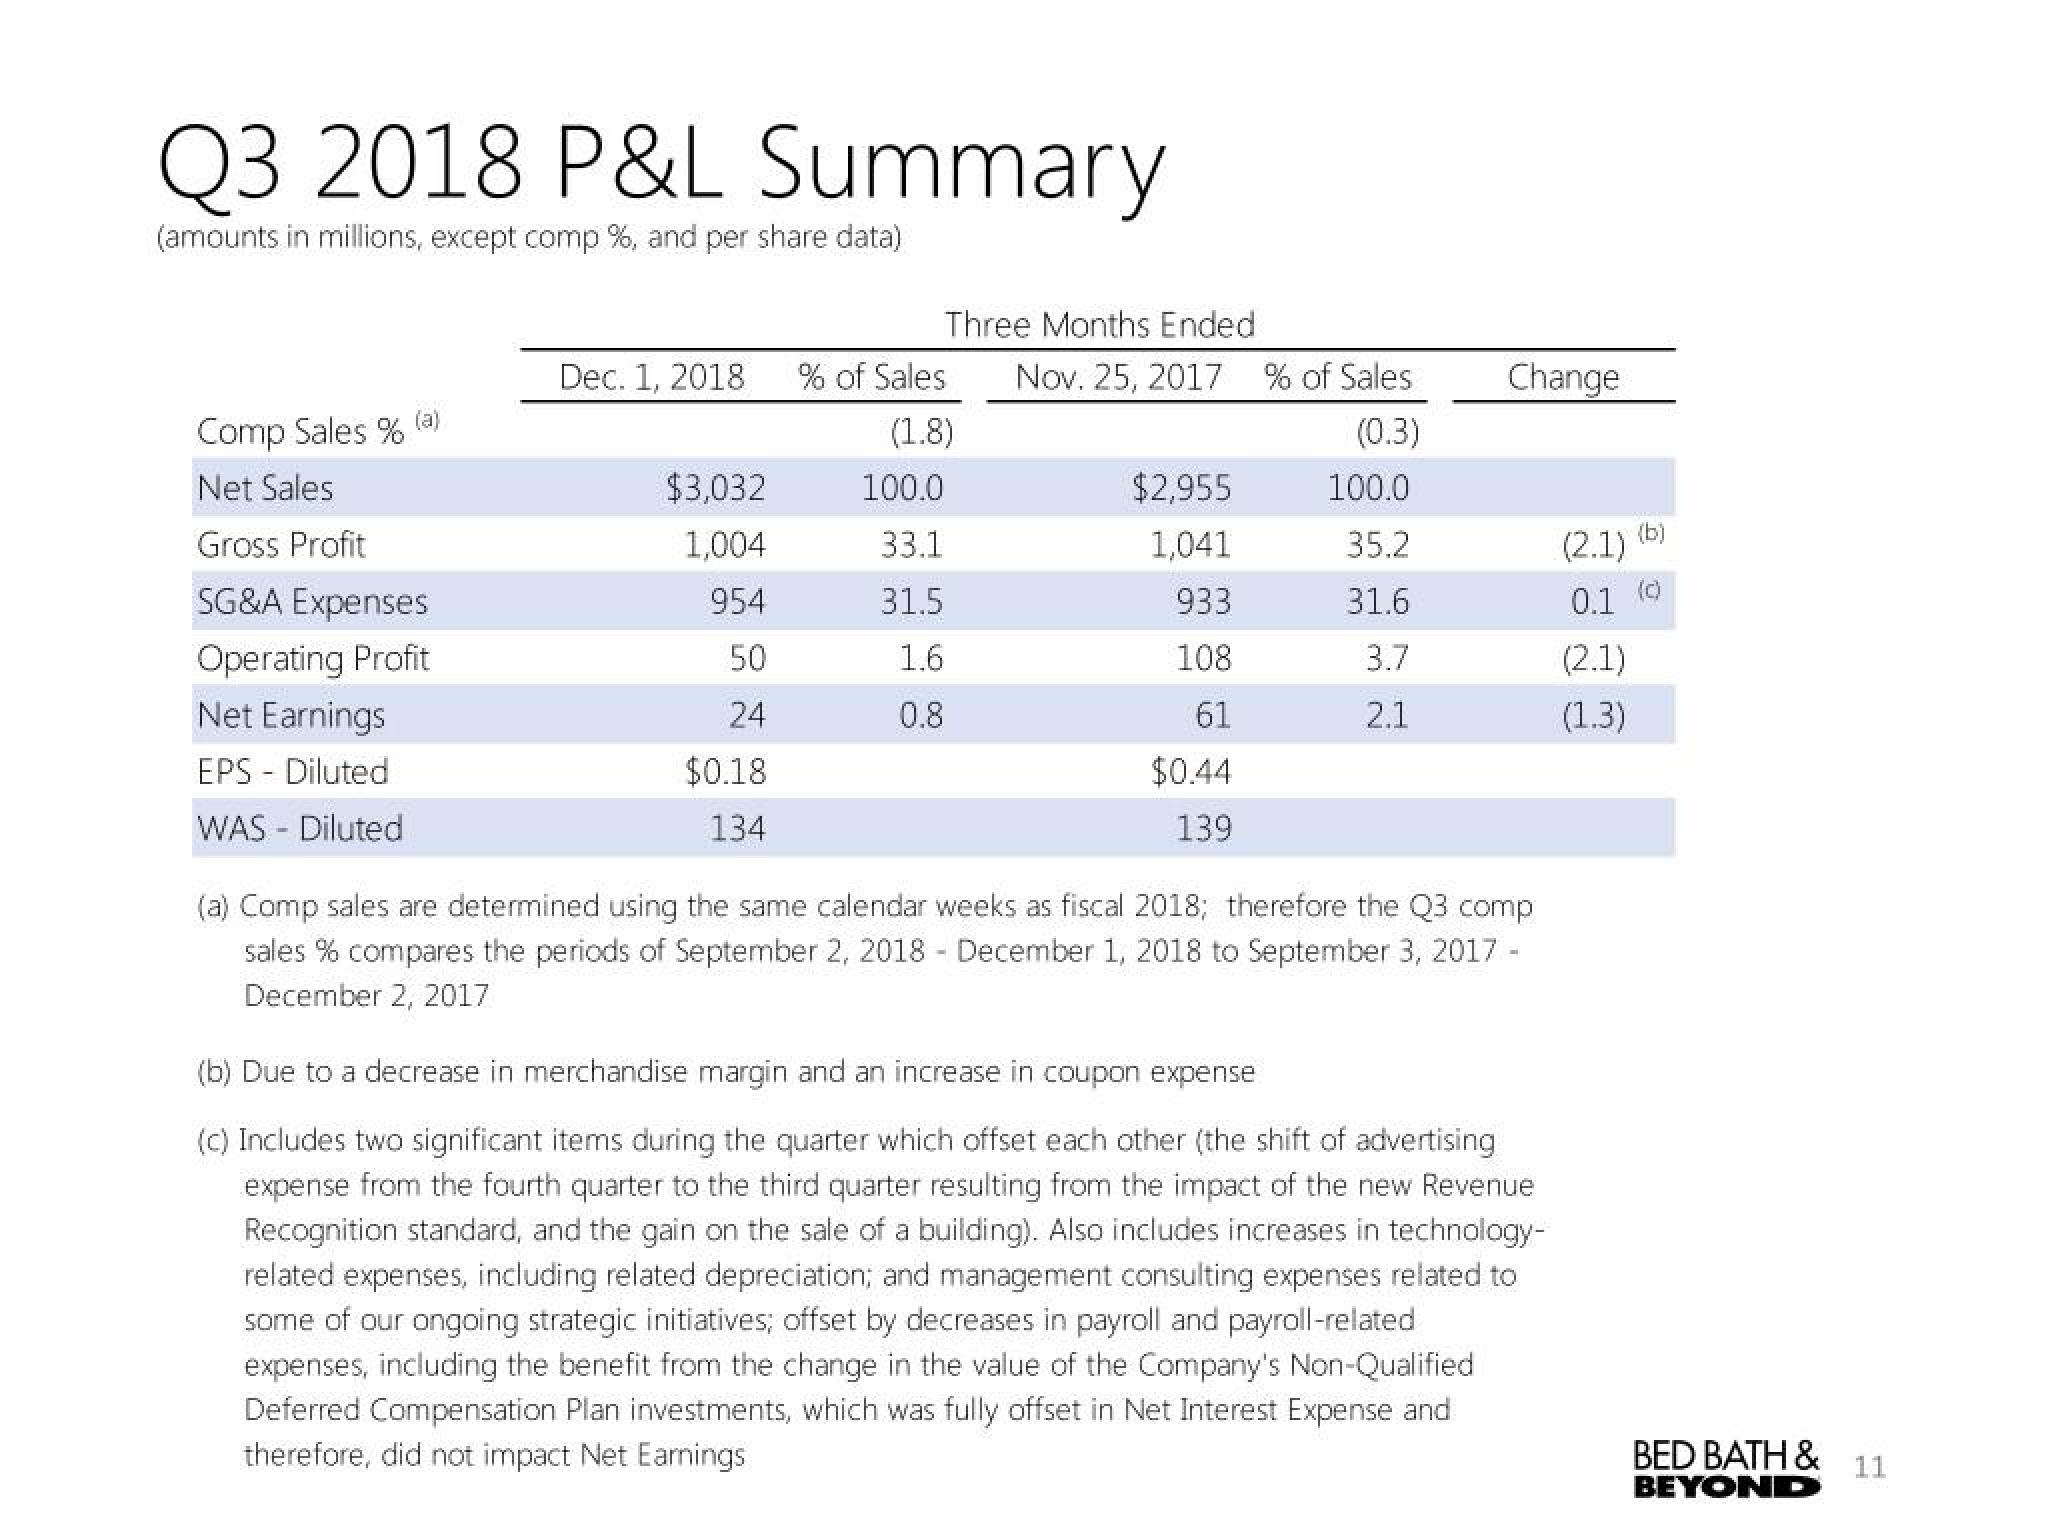
Q3 2018 P&L Summary
(amounts in millions, except comp %, and per share data)
Comp Sales %
Net Sales
Gross Profit
SG&A Expenses
Operating Profit
Net Earnings
EPS - Diluted
WAS - Diluted
Three Months Ended
Dec. 1, 2018 % of Sales
(1.8)
$3,032
1,004
954
50
24
$0.18
134
100.0
33.1
31.5
1.6
0.8
Nov. 25, 2017 % of Sales
(0.3)
$2,955
1,041
933
108
61
$0.44
139
100.0
35.2
31.6
3.7
2.1
Change
(a) Comp sales are determined using the same calendar weeks as fiscal 2018; therefore the Q3 comp
sales % compares the periods of September 2, 2018 December 1, 2018 to September 3, 2017 -
December 2, 2017
(b) Due to a decrease in merchandise margin and an increase in coupon expense
(c) Includes two significant items during the quarter which offset each other (the shift of advertising
expense from the fourth quarter to the third quarter resulting from the impact of the new Revenue
Recognition standard, and the gain on the sale of a building). Also includes increases in technology-
related expenses, including related depreciation; and management consulting expenses related to
some of our ongoing strategic initiatives; offset by decreases in payroll and payroll-related
expenses, including the benefit from the change in the value of the Company's Non-Qualified
Deferred Compensation Plan investments, which was fully offset in Net Interest Expense and
therefore, did not impact Net Earnings
(b)
(2.1)
0.1 (Ⓒ)
(2.1)
(1.3)
BED BATH &
BEYOND
11View entire presentation