Barclays Credit Presentation Deck
STRATEGY, TARGETS
& GUIDANCE
Structural cost actions
Performance costs
PERFORMANCE
Base costs¹
ASSET QUALITY
14,439
648
1,745
21 | Barclays Q4 2021 Results | 23 February 2022
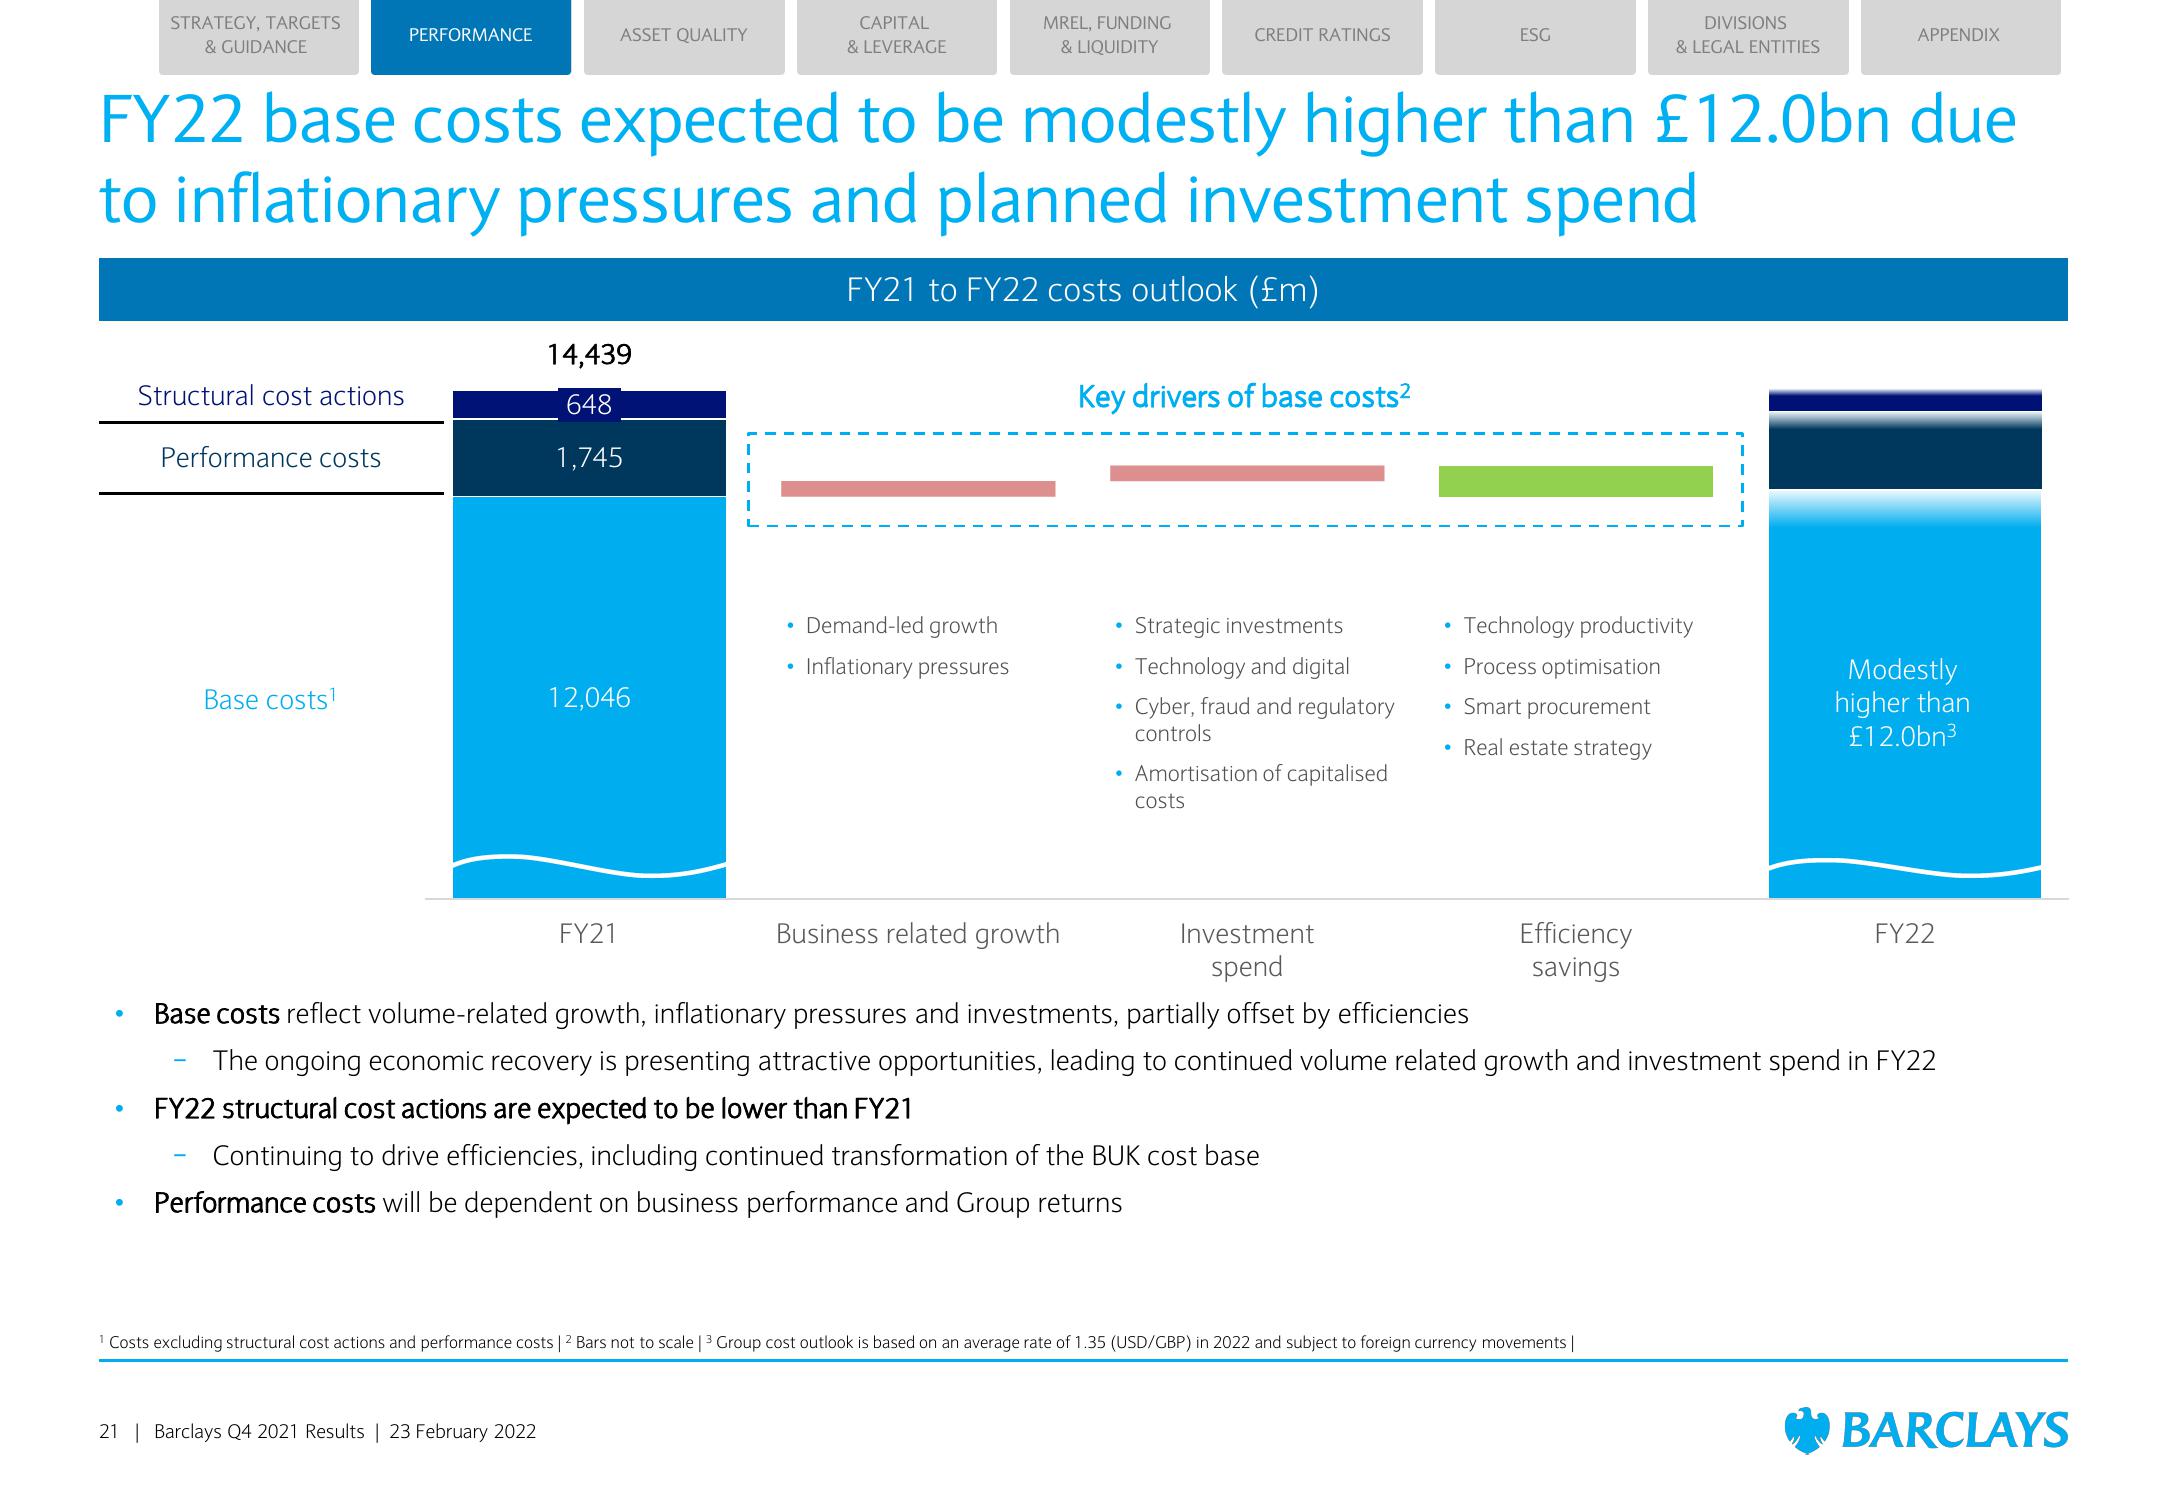
FY22 base costs expected to be modestly higher than £12.0bn due
to inflationary pressures and planned investment spend
FY21 to FY22 costs outlook (£m)
12,046
CAPITAL
& LEVERAGE
FY21
MREL, FUNDING
& LIQUIDITY
Demand-led growth
Inflationary pressures
CREDIT RATINGS
Key drivers of base costs²
Strategic investments
Technology and digital
Cyber, fraud and regulatory
controls
• Amortisation of capitalised
costs
.
ESG
Investment
spend
●
Technology productivity
• Process optimisation
• Smart procurement
• Real estate strategy
DIVISIONS
& LEGAL ENTITIES
Business related growth
Base costs reflect volume-related growth, inflationary pressures and investments, partially offset by efficiencies
The ongoing economic recovery is presenting attractive opportunities, leading to continued volume related growth and investment spend in FY22
FY22 structural cost actions are expected to be lower than FY21
Continuing to drive efficiencies, including continued transformation of the BUK cost base
Performance costs will be dependent on business performance and Group returns
Efficiency
savings
¹ Costs excluding structural cost actions and performance costs | ² Bars not to scale | ³ Group cost outlook is based on an average rate of 1.35 (USD/GBP) in 2022 and subject to foreign currency movements |
APPENDIX
Modestly
higher than
£12.0bn³
FY22
BARCLAYSView entire presentation