Silicon Valley Bank Results Presentation Deck
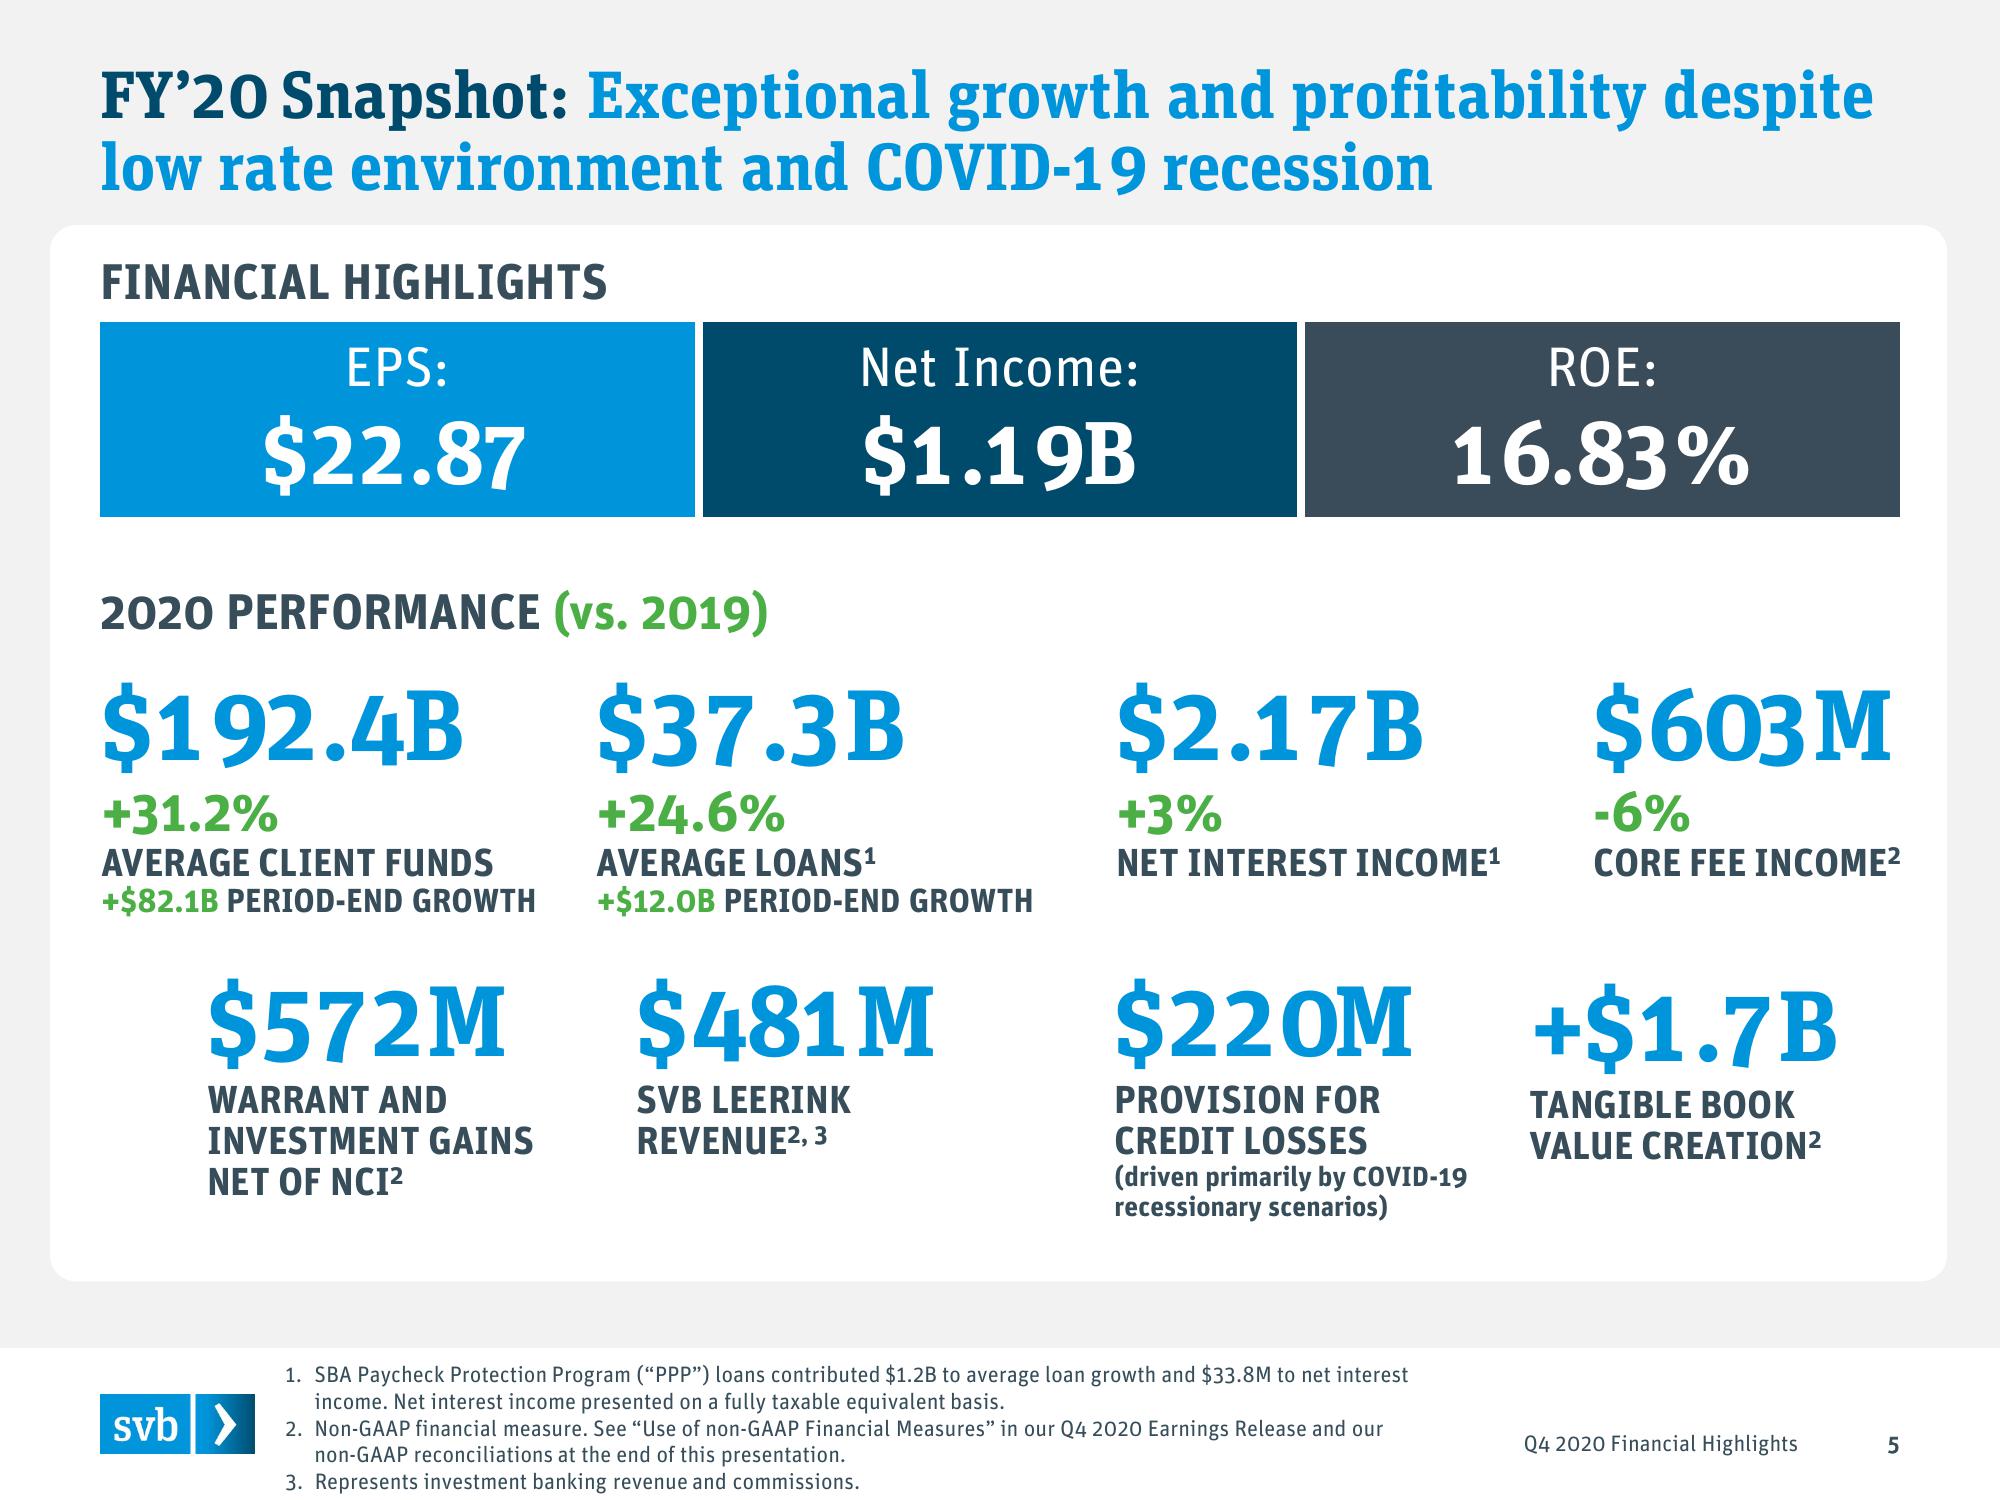
FY'20 Snapshot: Exceptional growth and profitability despite
low rate environment and COVID-19 recession
FINANCIAL HIGHLIGHTS
EPS:
$22.87
2020 PERFORMANCE (vs. 2019)
$192.4B
+31.2%
AVERAGE CLIENT FUNDS
+$82.1B PERIOD-END GROWTH
$572M
WARRANT AND
INVESTMENT GAINS
NET OF NCI²
svb >
Net Income:
$1.19B
$37.3B
+24.6%
AVERAGE LOANS¹
+$12.0B PERIOD-END GROWTH
$481 M
SVB LEERINK
REVENUE², 3
ROE:
16.83%
$2.17B
+3%
NET INTEREST INCOME¹
$220M
PROVISION FOR
CREDIT LOSSES
(driven primarily by COVID-19
recessionary scenarios)
1. SBA Paycheck Protection Program ("PPP") loans contributed $1.2B to average loan growth and $33.8M to net interest
income. Net interest income presented on a fully taxable equivalent basis.
2. Non-GAAP financial measure. See "Use of non-GAAP Financial Measures" in our Q4 2020 Earnings Release and our
non-GAAP reconciliations at the end of this presentation.
3. Represents investment banking revenue and commissions.
$603 M
-6%
CORE FEE INCOME²
+$1.7B
TANGIBLE BOOK
VALUE CREATION²
Q4 2020 Financial Highlights
5View entire presentation