Silicon Valley Bank Results Presentation Deck
Strong balance sheet growth driving NII with
NIM headwinds
(2 of 2)
TOTAL FUNDING SOURCES
Billions
Non-interest-
Bearing
Deposits
Interest-bearing
Deposits
Borrowings
Other
$46.8
0.02%
2017
$53.3
0.06%
2018
$55.0
23%
Total
Cost of
$57.9 Deposits
36%
Q1 2019 Q2 2019
* Outlook as of 7/25/19 and does not reflect change in Fed Funds rate on
7/31/19
svb> Q2 2019 Corporate Overview and Financial Results
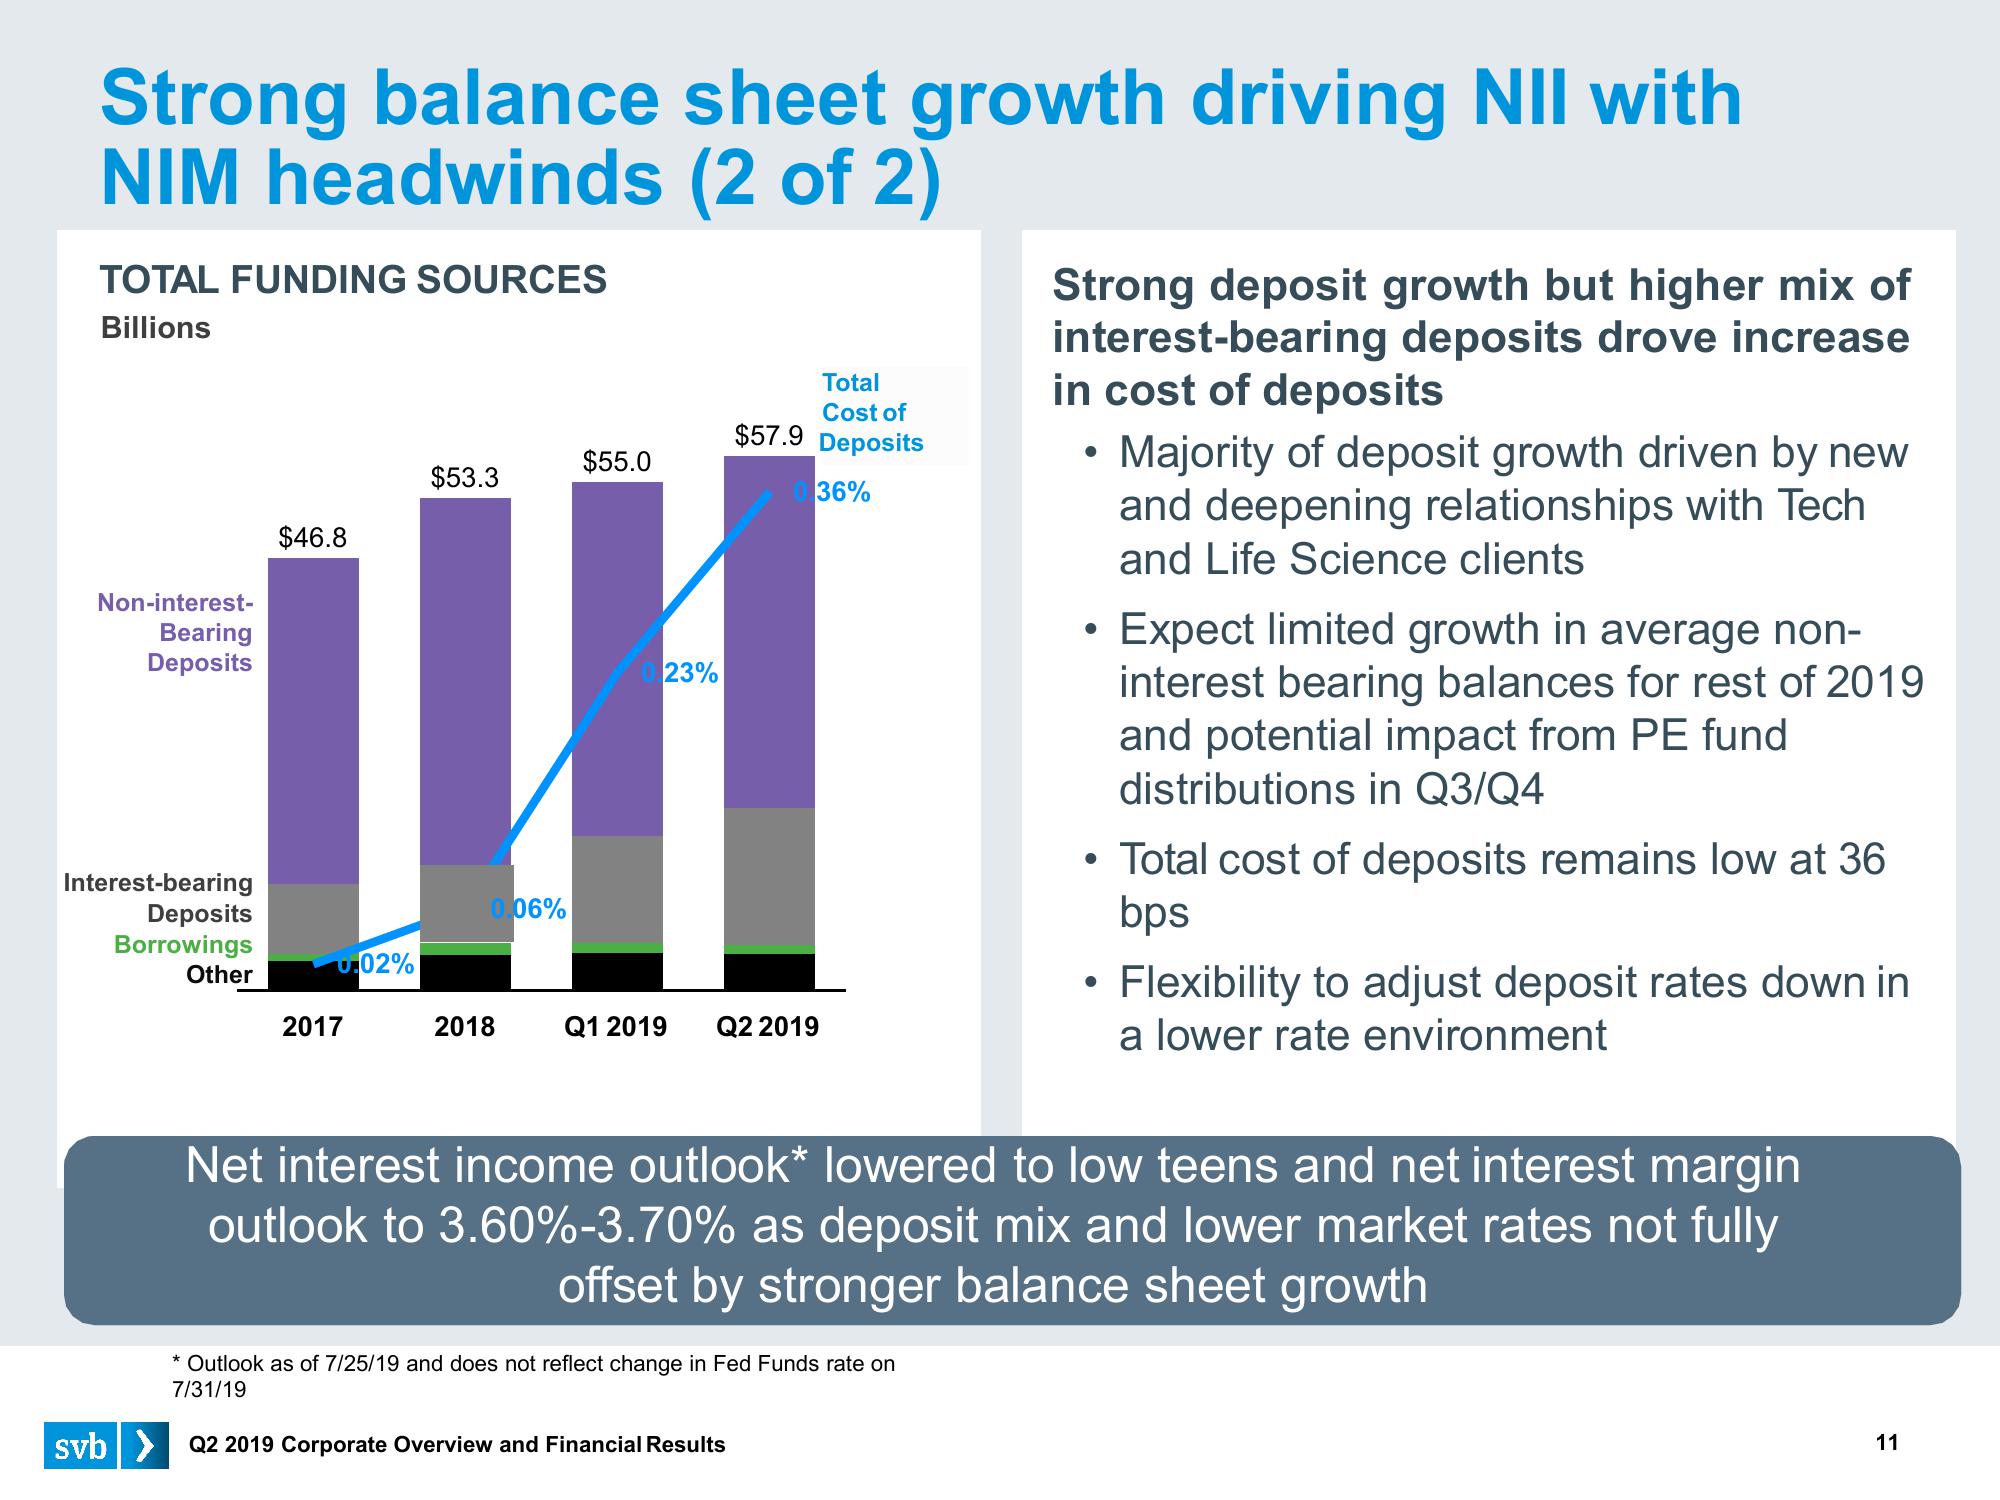
Strong deposit growth but higher mix of
interest-bearing deposits drove increase
in cost of deposits
●
Majority of deposit growth driven by new
and deepening relationships with Tech
and Life Science clients
Expect limited growth in average non-
interest bearing balances for rest of 2019
and potential impact from PE fund
distributions in Q3/Q4
Total cost of deposits remains low at 36
bps
Net interest income outlook* lowered to low teens and net interest margin
outlook to 3.60%-3.70% as deposit mix and lower market rates not fully
offset by stronger balance sheet growth
Flexibility to adjust deposit rates down in
a lower rate environment
11View entire presentation