HashiCorp Investor Presentation Deck
GAAP to Non-GAAP Reconciliations
($ Millions, except percentages) ¹
Total Revenue
Sales and marketing (S&M) expense on a GAAP basis
Less: Stock-based compensation expense¹
Non-GAAP S&M expense
Non-GAAP S&M expense as a % of total revenue
Research and development (R&D) expense on a GAAP basis
Less: Stock-based compensation expense¹
Non-GAAP R&D expense
Non-GAAP R&D expense as a % of total revenue
General and Administrative (G&A) expense on a GAAP basis
Less: Stock-based compensation expense¹
Non-GAAP G&A expense
Non-GAAP G&A expense as a % of total revenue
FY2020
Q1
Q2
Q3
Q4
$22.2 $26.4 $33.5 $39.2
$16.6 $20.8 $25.2 $26.8
$ 0.5 $ 0.8 $ 0.6 $ 0.6
$ 16.1 $20.0 $24.6 $26.2
72.0% 76.0% 73.0% 67.0%
$
$
$
8.0 $ 9.3
0.3 $ 0.3
7.7 $ 8.9
35.0% 34.0%
$11.1
$ 0.4
$ 10.7
32.0%
$11.7
$ 0.4
$11.3
29.0%
$
6.0 $
$ 2.1 $
5.1 $ 5.9 $ 7.2
0.9 $ 1.0 $ 1.0
4.1 $ 4.9 $ 6.2
18.0% 16.0% 15.0% 16.0%
$ 3.9 $
FY2020
$ 121.3
$ 89.3
$ 2.5
$ 86.8
72.0%
$40.1
$ 1.5
$38.6
32.0%
$24.1
$ 5.0
$ 19.1
16.0%
FY2021
Q4
Q1
Q2
Q3
$44.3 $50.5 $ 55.2 $ 61.8
$32.9 $43.1 $31.9 $ 33.2
$ 0.6 $ 9.5 $ 0.6 $ 0.6
$32.2 $ 33.6 $ 31.3 $32.6
73.0% 66.0% 57.0% 53.0%
$14.5 $19.8
$ 0.4 $ 4.7
$14.1 $ 15.1
32.0% 30.0%
$15.1 $15.9
$ 0.4 $ 0.4
$ 14.6 $ 15.4
26.0% 25.0%
$ 7.3 $25.5 $ 7.3 $ 8.5
$ 0.7 $18.7 $ 0.6 $ 0.5
$ 6.6 $ 6.8 $ 6.7 $ 7.9
15.0% 13.0% 12.0% 13.0%
FY2021
$ 211.9
$141.0
$11.3
$ 129.7
61.0%
$ 65.2
$ 6.0
$ 59.3
28.0%
$ 48.5
$20.6
$ 27.9
13.0%
Q1
$66.9
FY2022
Q2
Q3
Q4
$ 75.1 $82.2 $ 96.6
$38.9 $50.0 $ 53.5 $127.1
$ 0.7 $ 0.5 $ 0.5 $ 63.2
$38.2 $ 49.5 $ 53.0 $ 63.9
57.0% 66.0% 64.0% 66.0%
$18.1 $24.9 $25.7 $ 96.3
$ 0.4 $ 0.4 $ 0.4 $ 66.6
$ 17.7 $ 24.5 $ 25.3 $ 29.7
26.0% 33.0% 31.0% 31.0%
$ 12.6 $ 12.4 $13.5 $ 73.6
$ 0.5 $ 0.5 $ 0.4 $ 52.5
$ 12.2
$ 11.9 $ 13.1 $ 21.1
18.0% 16.0% 16.0% 22.0%
2
FY2022
$320.8
$ 269.5
$ 64.9
$ 204.6
64.0%
$ 165.0
$ 67.9
$ 97.1
30.0%
$112.1
$ 53.8
$ 58.3
18.0%
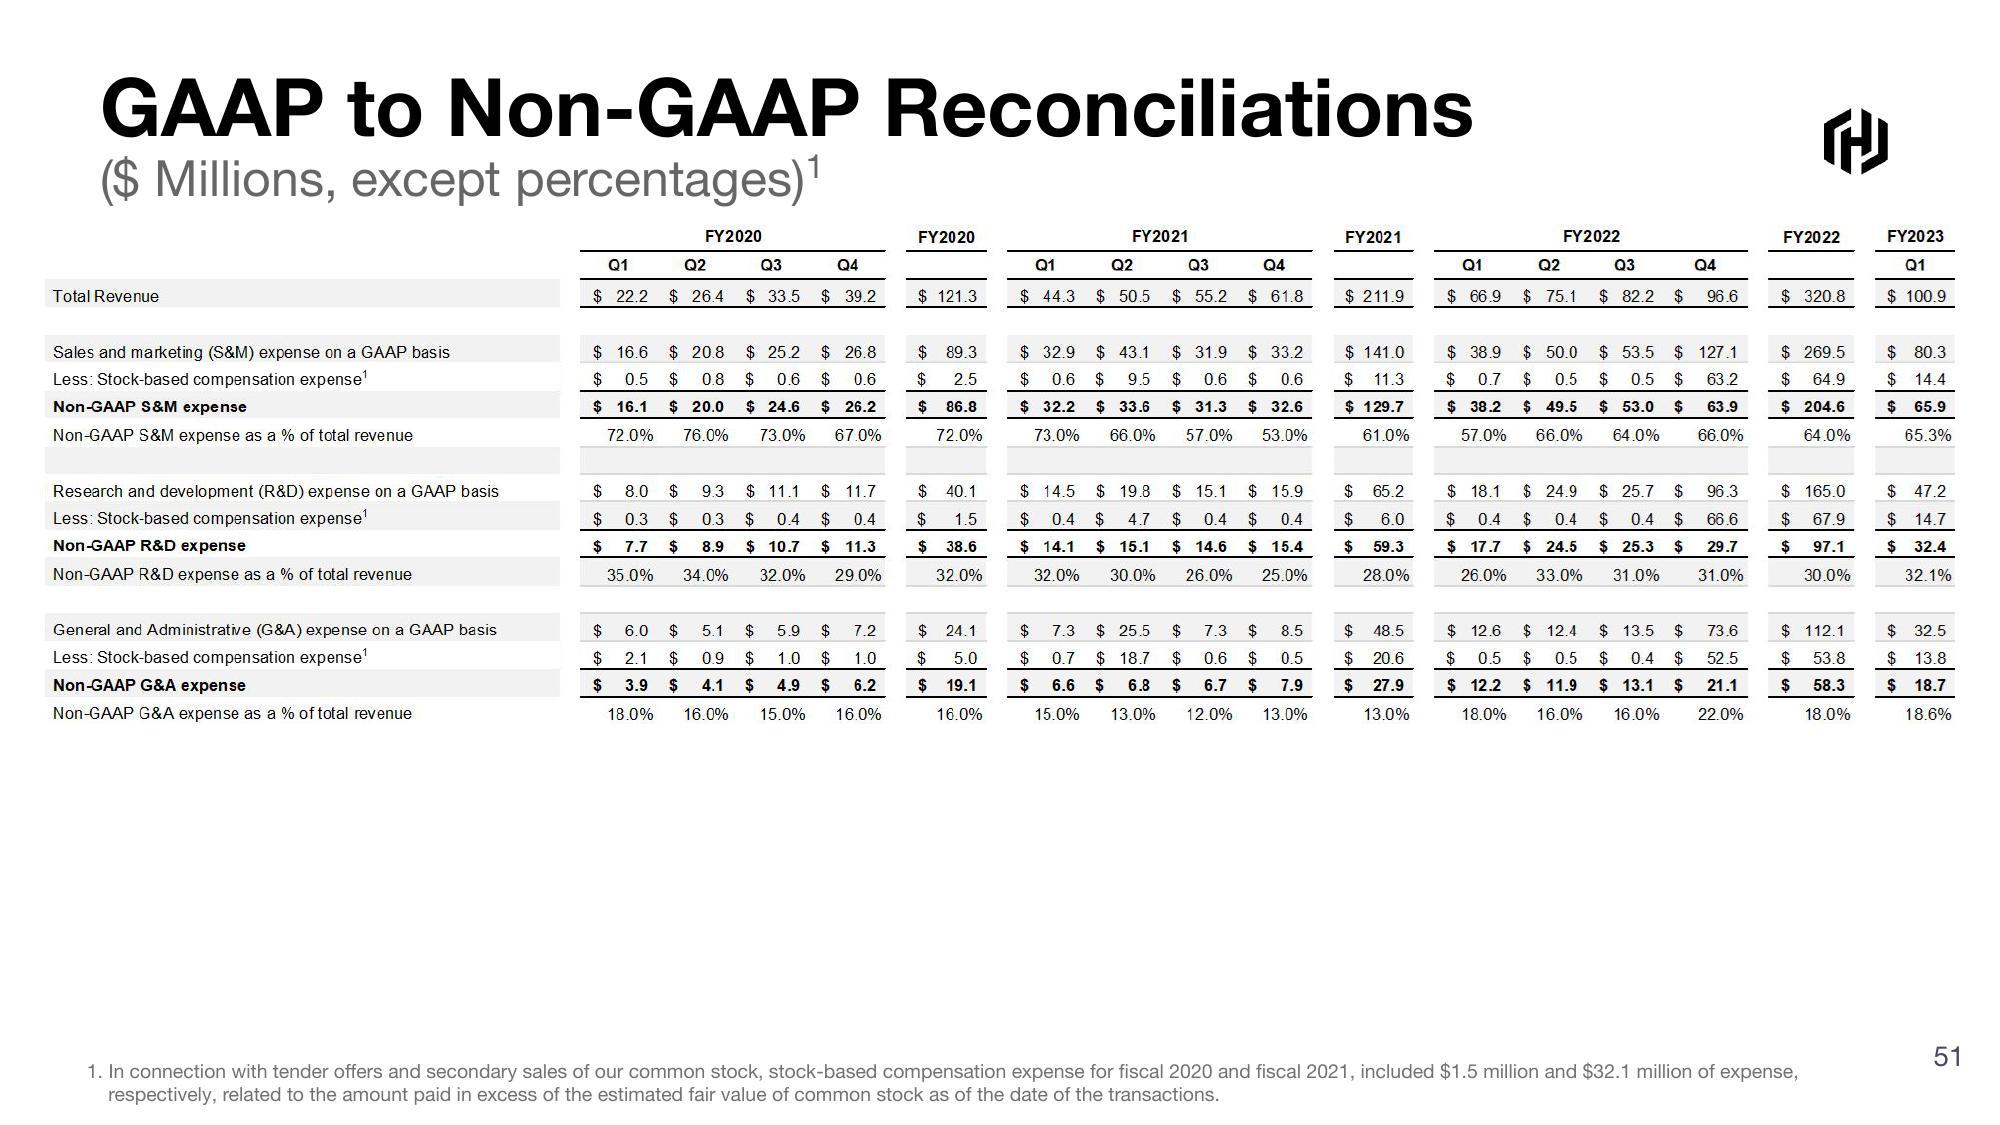
1. In connection with tender offers and secondary sales of our common stock, stock-based compensation expense for fiscal 2020 and fiscal 2021, included $1.5 million and $32.1 million of expense,
respectively, related to the amount paid in excess of the estimated fair value of common stock as of the date of the transactions.
FY2023
Q1
$100.9
$ 80.3
$14.4
$65.9
65.3%
$ 47.2
$14.7
$32.4
32.1%
$32.5
$13.8
$18.7
18.6%
51View entire presentation