Ocado Results Presentation Deck
Judging our progress: refreshing our KPIs
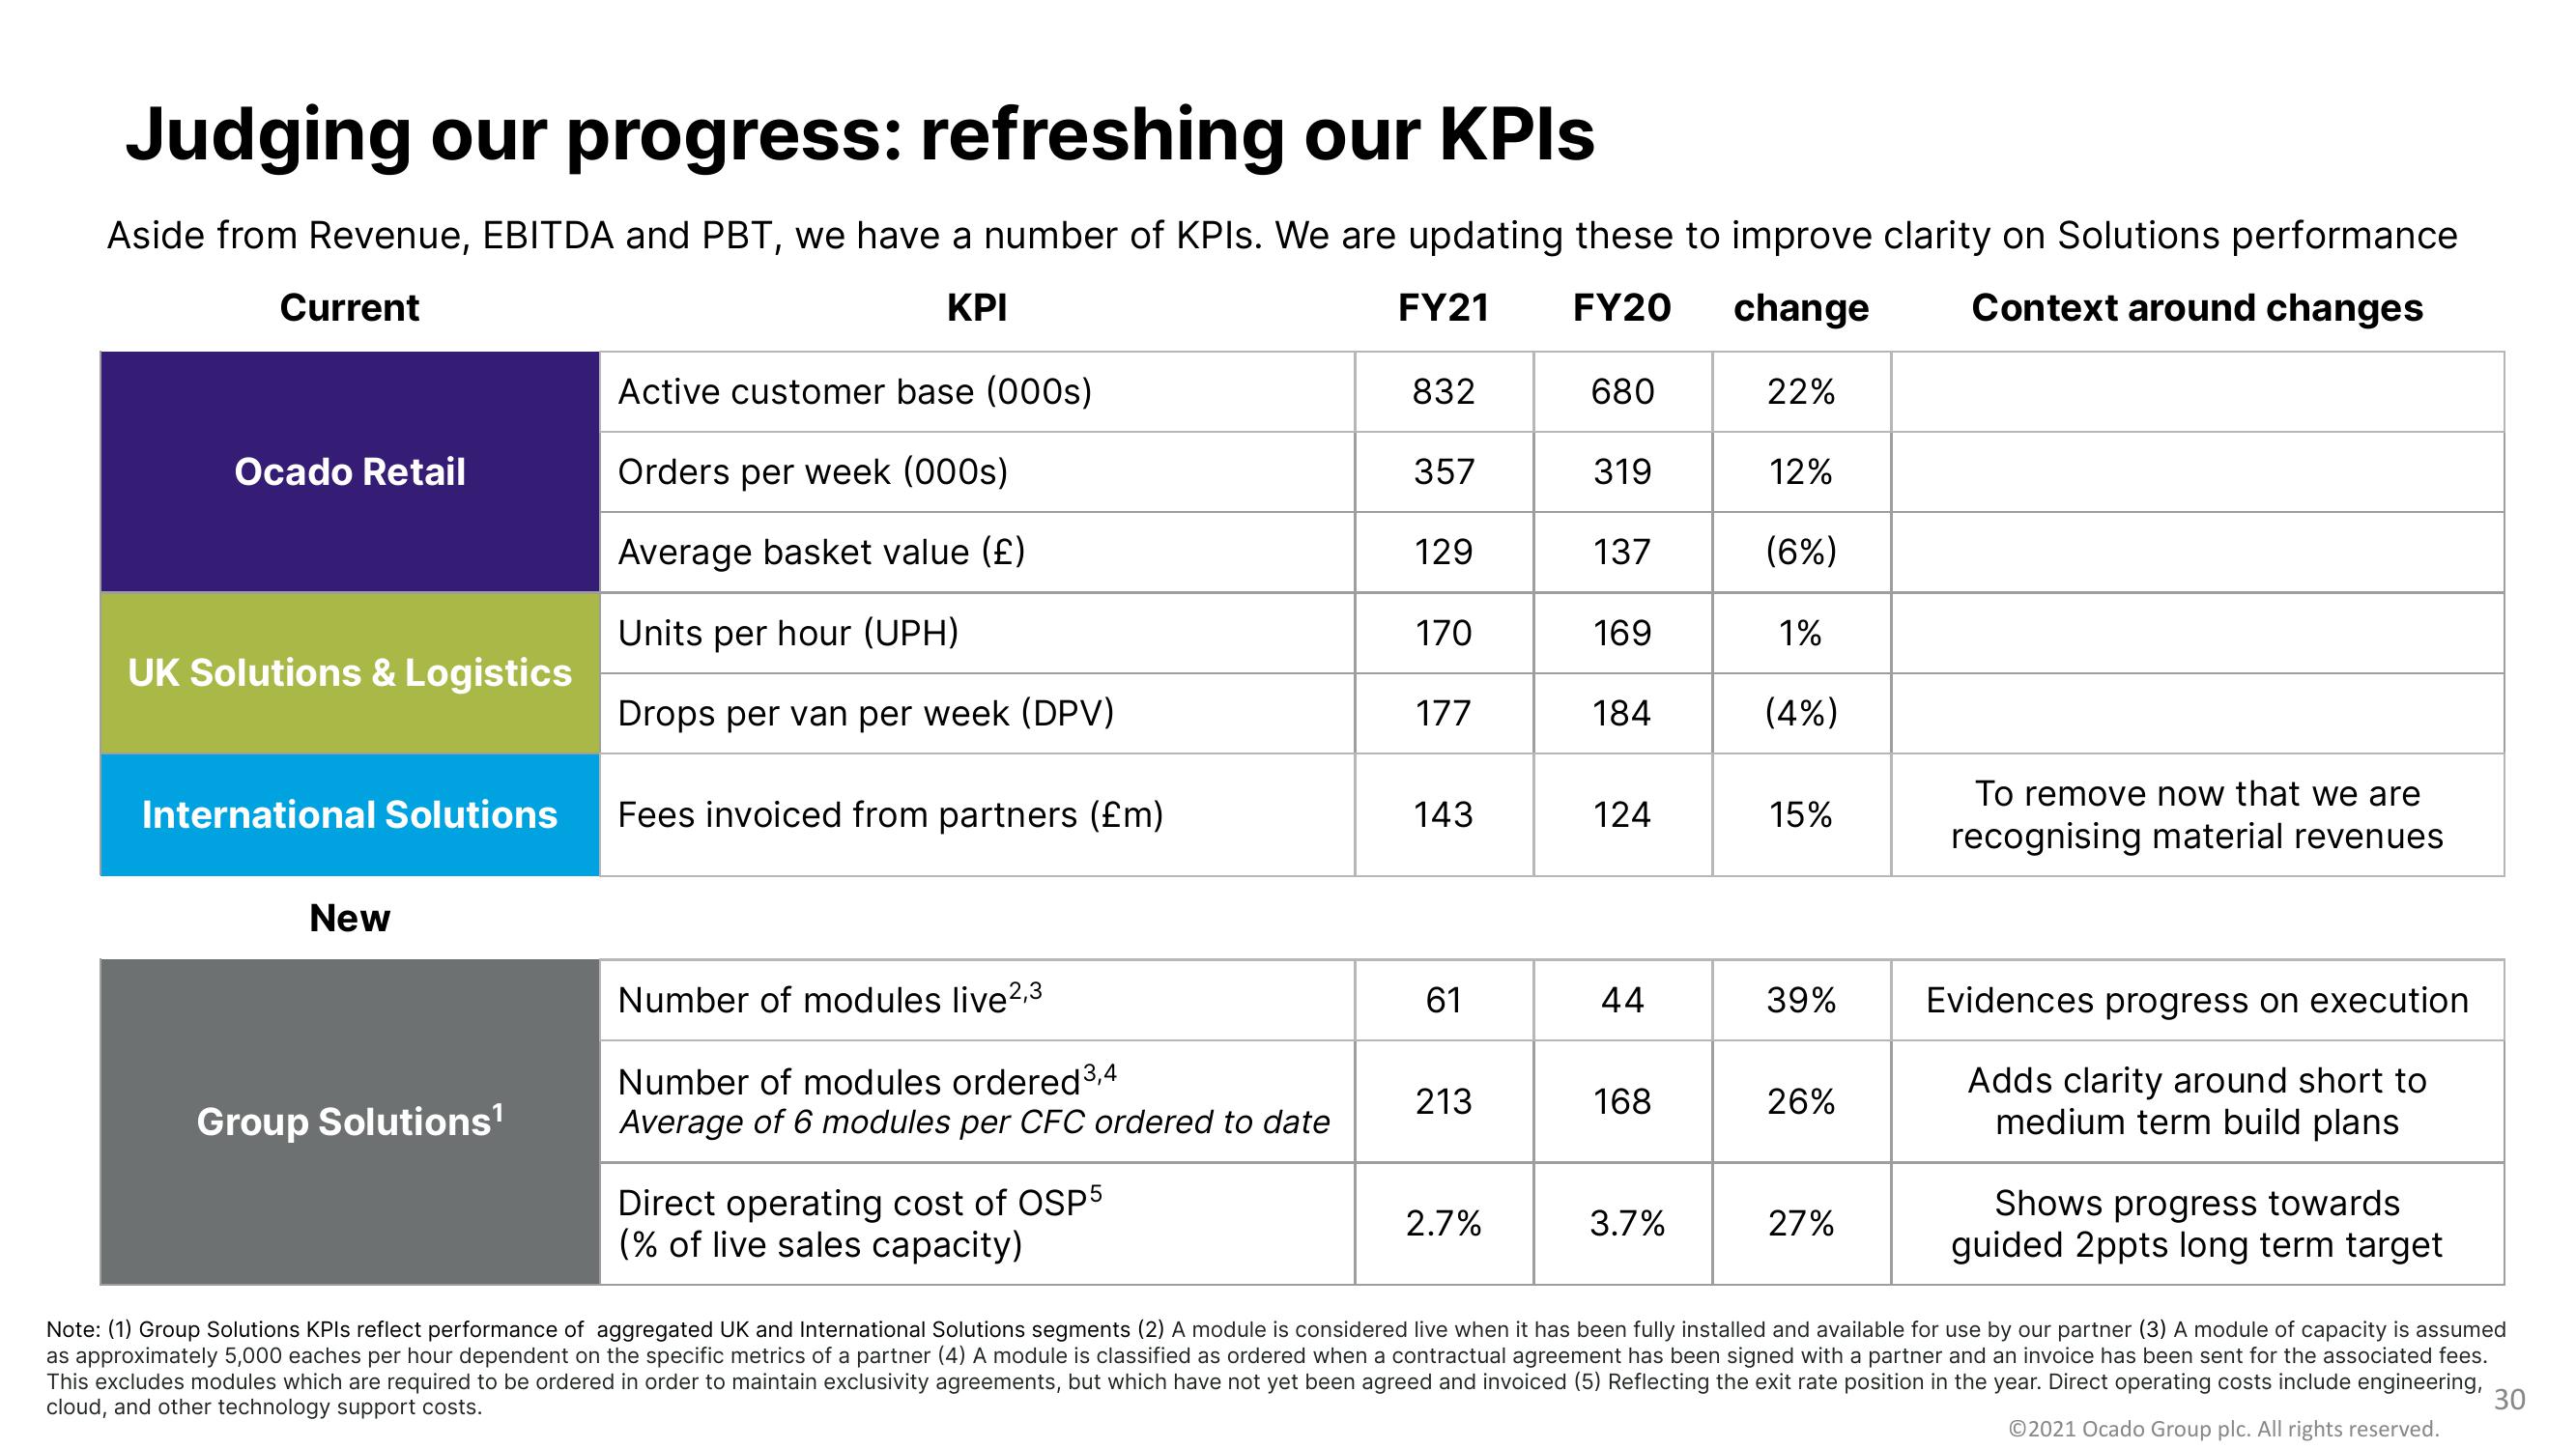
Aside from Revenue, EBITDA and PBT, we have a number of KPIs. We are updating these to improve clarity on Solutions performance
Current
ΚΡΙ
FY21
FY20 change
Context around changes
22%
Ocado Retail
UK Solutions & Logistics
International Solutions
New
Group Solutions¹
Active customer base (000s)
Orders per week (000s)
Average basket value (£)
Units per hour (UPH)
Drops per van per week (DPV)
Fees invoiced from partners (£m)
Number of modules live ²,3
Number of modules ordered 3,4
Average of 6 modules per CFC ordered to date
Direct operating cost of OSP5
(% of live sales capacity)
832
357
129
170
177
143
61
213
2.7%
680
319
137
169
184
124
44
168
3.7%
12%
(6%)
1%
(4%)
15%
39%
26%
27%
To remove now that we are
recognising material revenues
Evidences progress on execution
Adds clarity around short to
medium term build plans
Shows progress towards
guided 2ppts long term target
Note: (1) Group Solutions KPIs reflect performance of aggregated UK and International Solutions segments (2) A module is considered live when it has been fully installed and available for use by our partner (3) A module of capacity is assumed
as approximately 5,000 eaches per hour dependent on the specific metrics of a partner (4) A module is classified as ordered when a contractual agreement has been signed with a partner and an invoice has been sent for the associated fees.
This excludes modules which are required to be ordered in order to maintain exclusivity agreements, but which have not yet been agreed and invoiced (5) Reflecting the exit rate position in the year. Direct operating costs include engineering,
cloud, and other technology support costs.
Ⓒ2021 Ocado Group plc. All rights reserved.
30View entire presentation