Evercore Investment Banking Pitch Book
Supplemental Soda Ash Pricing Data
Export Soda Ash Prices i
$300
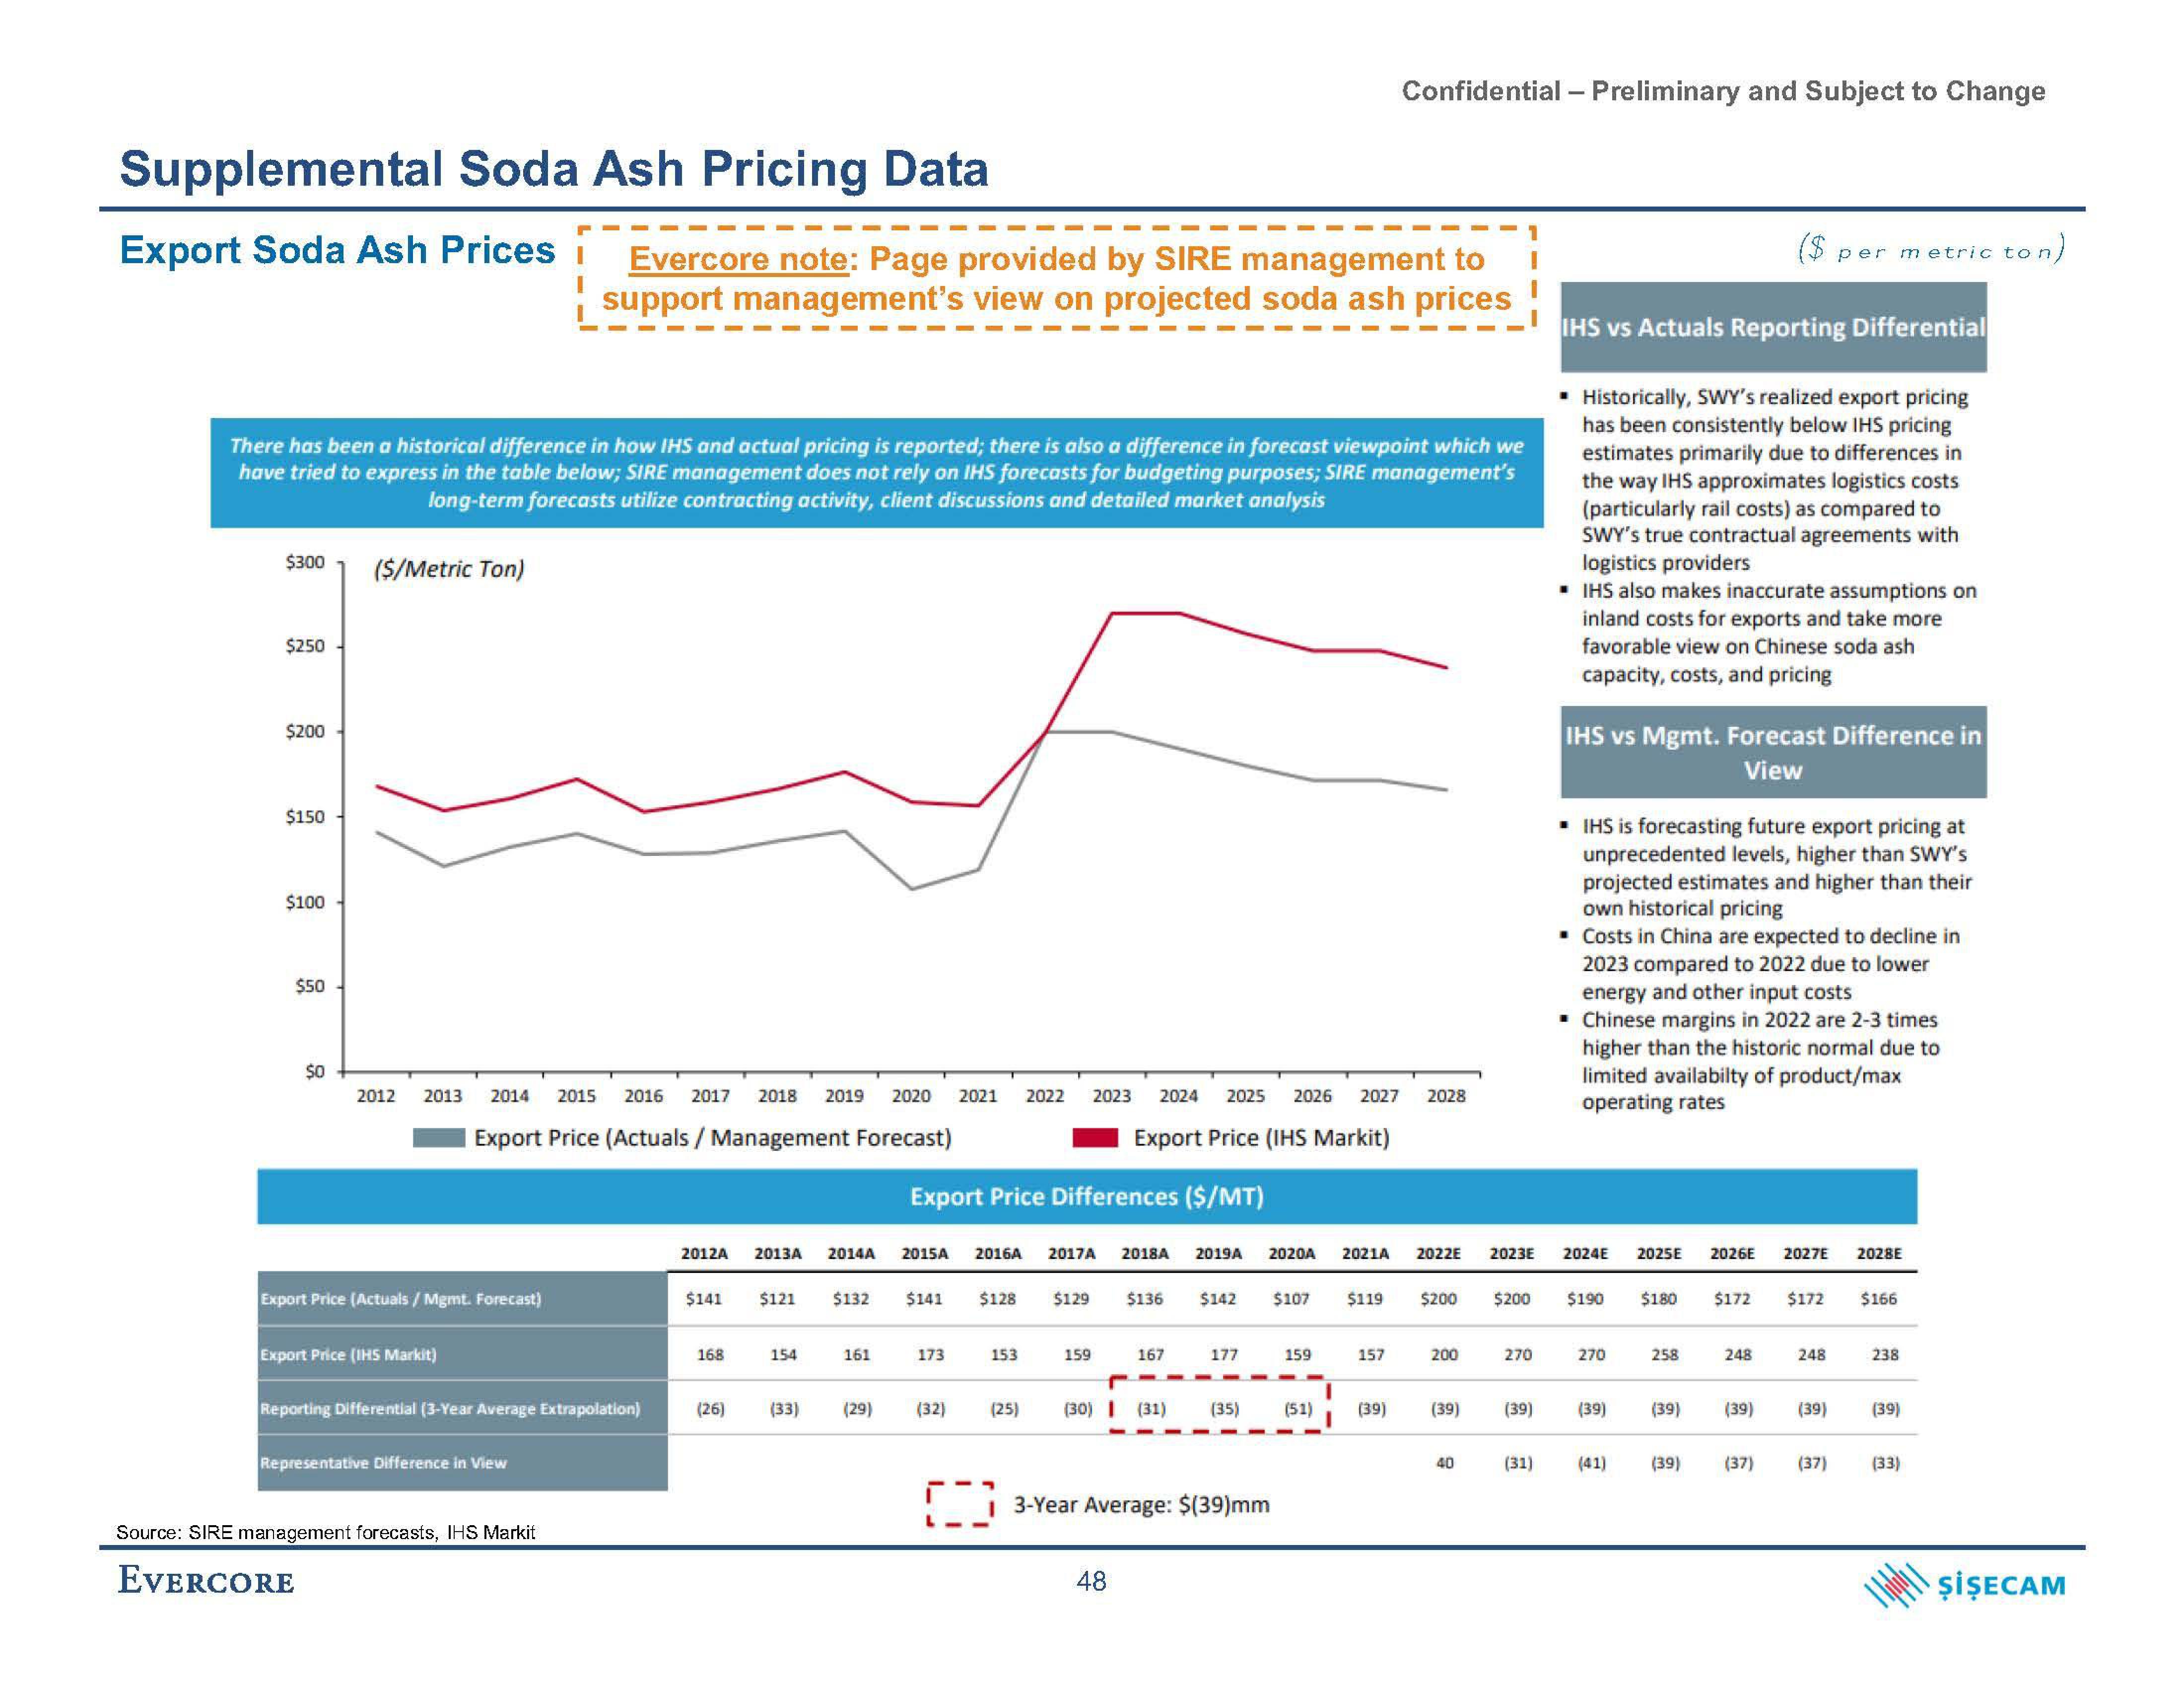
There has been a historical difference in how IHS and actual pricing is reported; there is also a difference in forecast viewpoint which we
have tried to express in the table below; SIRE management does not rely on IHS forecasts for budgeting purposes; SIRE management's
long-term forecasts utilize contracting activity, client discussions and detailed market analysis
$250
$200
$150
$100
$50
$0
($/Metric Ton)
2012
2013
Export Price (Actuals/Mgmt. Forecast)
Export Price (IHS Markit)
2014 2015 2016 2017 2018 2019 2020 2021 2022 2023 2024 2025 2026 2027 2028
Export Price (Actuals / Management Forecast)
Export Price (IHS Markit)
Evercore note: Page provided by SIRE management to
support management's view on projected soda ash prices
Reporting Differential (3-Year Average Extrapolation)
Representative Difference in View
Source: SIRE management forecasts, IHS Markit
EVERCORE
2012A 2013A 2014A
$141
168
(26)
$121
154
(33)
$132
161
(29)
Export Price Differences ($/MT)
2015A 2016A 2017A 2018A 2019A
173
(32)
$141 $128 $129 $136 $142 $107 $119 $200
153
159
10:00
(25) (30) I (31)
167
48
177
(35)
3-Year Average: $(39)mm
2020A 2021A
Confidential - Preliminary and Subject to Change
159
(51)
157
(39)
200
2022E 2023E 2024E
(39)
40
270
(39)
IHS vs Actuals Reporting Differential
Historically, SWY's realized export pricing
has been consistently below IHS pricing
estimates primarily due to differences in
the way IHS approximates logistics costs
(particularly rail costs) as compared to
SWY's true contractual agreements with
logistics providers
▪ IHS also makes inaccurate assumptions on
inland costs for exports and take more
favorable view on Chinese soda ash
capacity, costs, and pricing
(31)
IHS vs Mgmt. Forecast Difference in
View
▪ IHS is forecasting future export pricing at
unprecedented levels, higher than SWY's
projected estimates and higher than their
own historical pricing
■ Costs in China are expected to decline in
2023 compared to 2022 due to lower
energy and other input costs
▪ Chinese margins in 2022 are 2-3 times
higher than the historic normal due to
limited availabilty of product/max
operating rates
$200 $190 $180 $172 $172 $166
270
2025E 2026E 2027E 2028E
(41)
258
(39) (39) (39)
248
(39)
per metric ton)
(37)
248
(39)
(37)
238
(39)
(33)
ŞİŞECAMView entire presentation