Sonos Results Presentation Deck
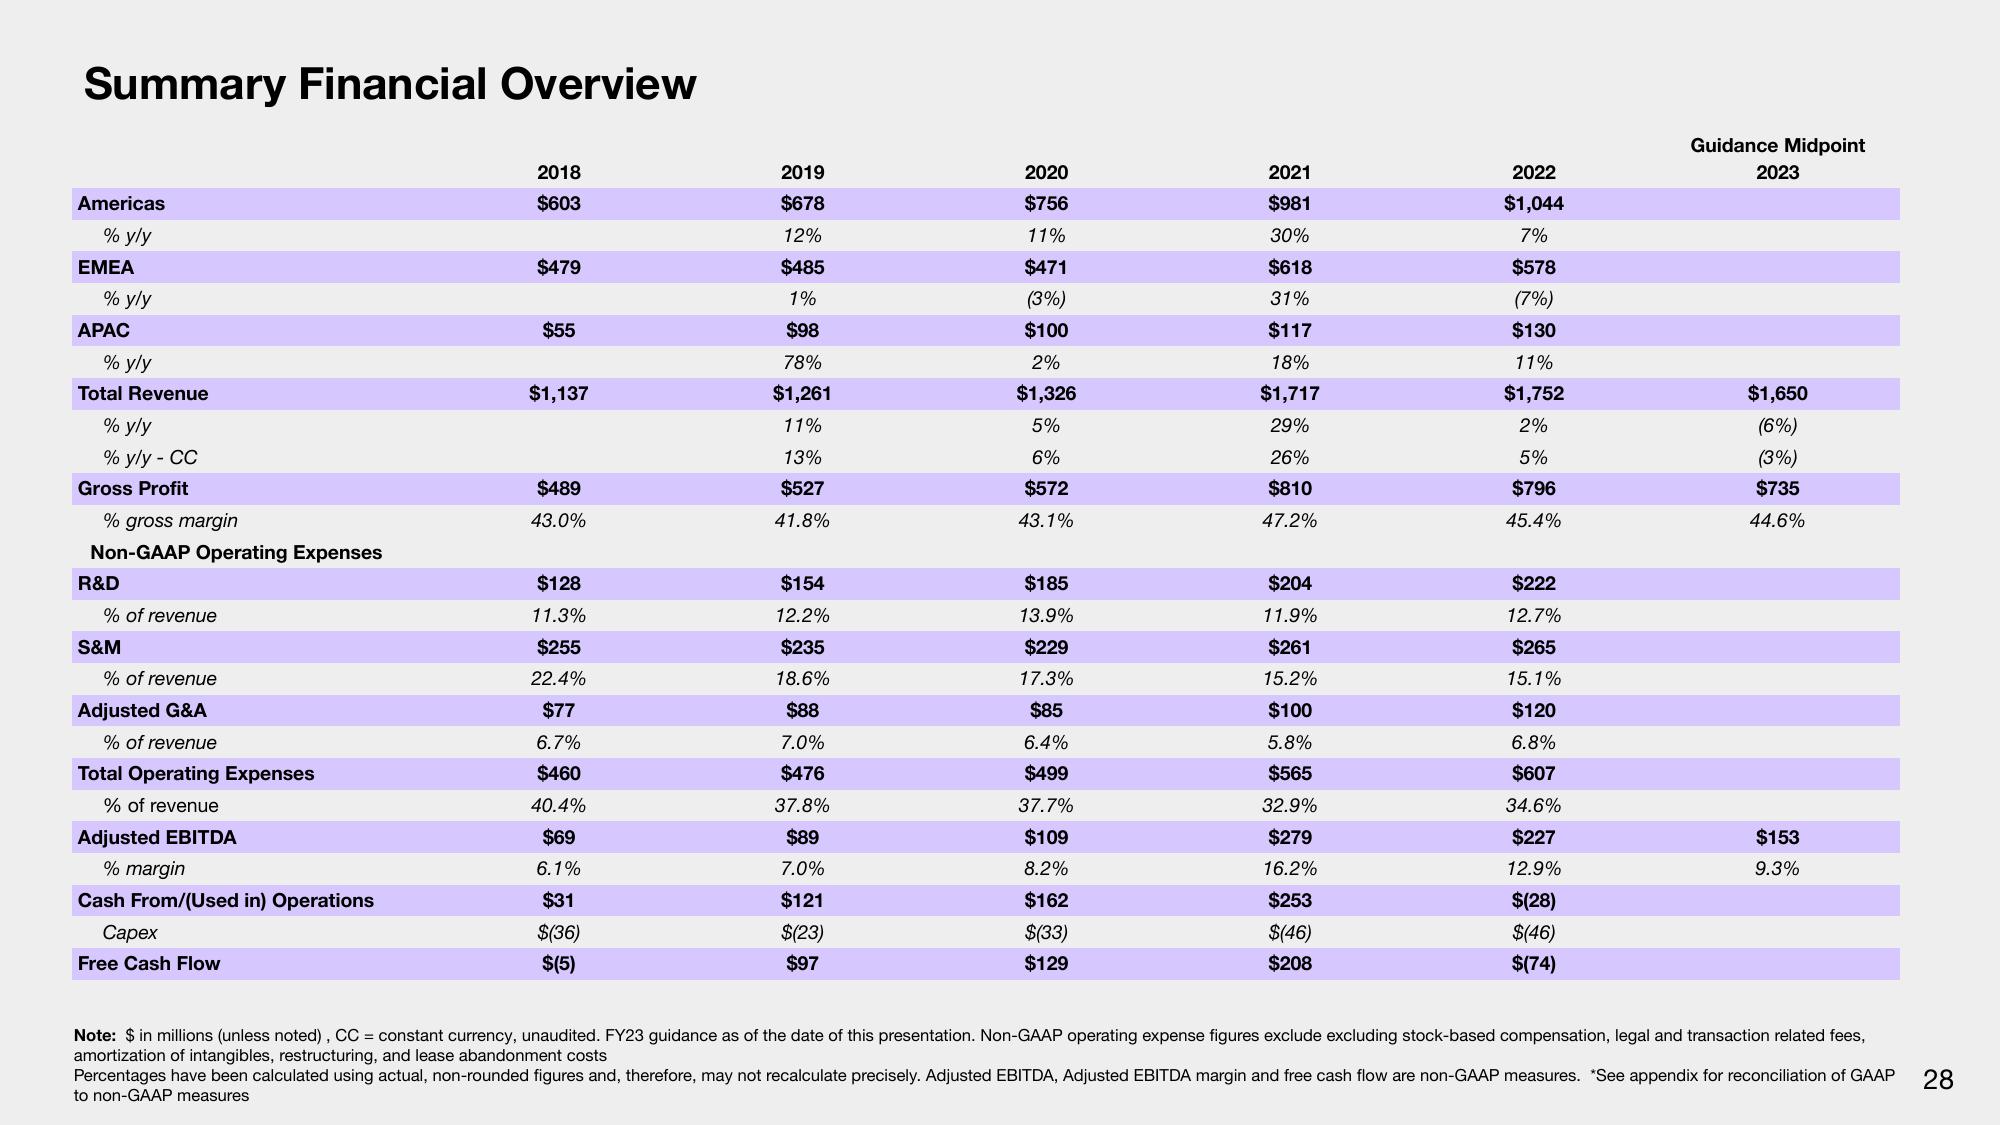
Summary Financial Overview
Americas
% y/y
EMEA
% y/y
APAC
% y/y
Total Revenue
% y/y
% y/y - CC
Gross Profit
% gross margin
Non-GAAP Operating Expenses
R&D
% of revenue
S&M
% of revenue
Adjusted G&A
% of revenue
Total Operating Expenses
% of revenue
Adjusted EBITDA
% margin
Cash From/(Used in) Operations
Capex
Free Cash Flow
2018
$603
$479
$55
$1,137
$489
43.0%
$128
11.3%
$255
22.4%
$77
6.7%
$460
40.4%
$69
6.1%
$31
$(36)
$(5)
2019
$678
12%
$485
1%
$98
78%
$1,261
11%
13%
$527
41.8%
$154
12.2%
$235
18.6%
$88
7.0%
$476
37.8%
$89
7.0%
$121
$(23)
$97
2020
$756
11%
$471
(3%)
$100
2%
$1,326
5%
6%
$572
43.1%
$185
13.9%
$229
17.3%
$85
6.4%
$499
37.7%
$109
8.2%
$162
$(33)
$129
2021
$981
30%
$618
31%
$117
18%
$1,717
29%
26%
$810
47.2%
$204
11.9%
$261
15.2%
$100
5.8%
$565
32.9%
$279
16.2%
$253
$(46)
$208
2022
$1,044
7%
$578
(7%)
$130
11%
$1,752
2%
5%
$796
45.4%
$222
12.7%
$265
15.1%
$120
6.8%
$607
34.6%
$227
12.9%
$(28)
$(46)
$(74)
Guidance Midpoint
2023
$1,650
(6%)
(3%)
$735
44.6%
$153
9.3%
Note: $ in millions (unless noted), CC = constant currency, unaudited. FY23 guidance as of the date of this presentation. Non-GAAP operating expense figures exclude excluding stock-based compensation, legal and transaction related fees,
amortization of intangibles, restructuring, and lease abandonment costs
Percentages have been calculated using actual, non-rounded figures and, therefore, may not recalculate precisely. Adjusted EBITDA, Adjusted EBITDA margin and free cash flow are non-GAAP measures. *See appendix for reconciliation of GAAP
to non-GAAP measures
28View entire presentation