Melrose Results Presentation Deck
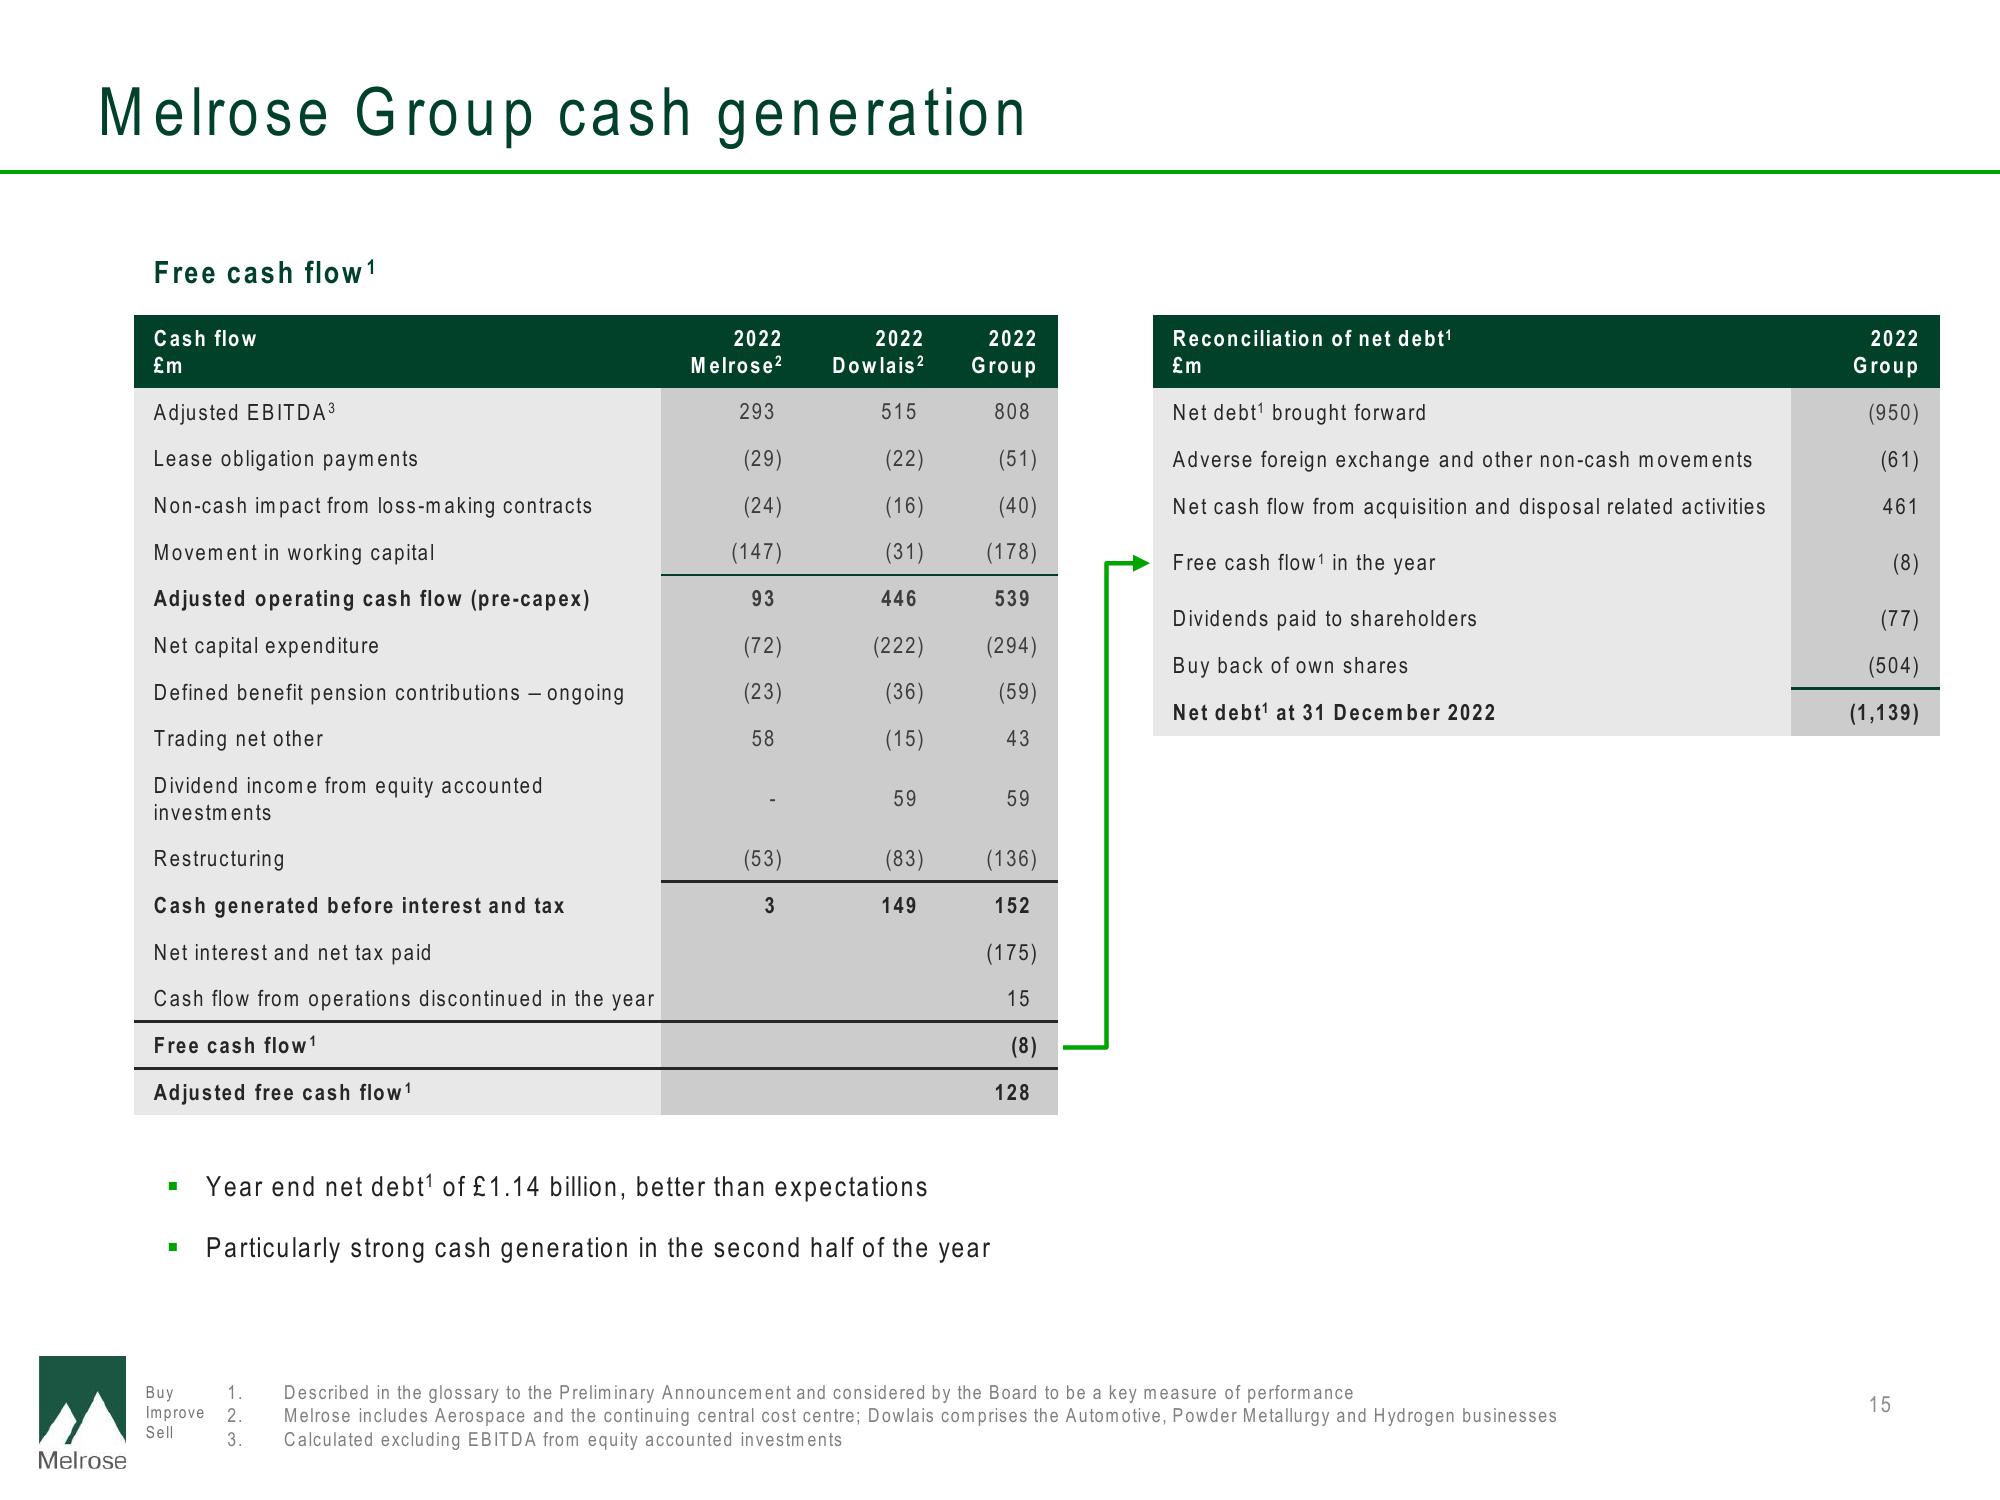
Melrose Group cash generation
Melrose
Free cash flow 1
Cash flow
£m
Adjusted EBITDA ³
Lease obligation payments
Non-cash impact from loss-making contracts
Movement in working capital
Adjusted operating cash flow (pre-capex)
Net capital expenditure
Defined benefit pension contributions - ongoing
Trading net other
Dividend income from equity accounted
investments
Restructuring
Cash generated before interest and tax
Net interest and net tax paid
Cash flow from operations discontinued in the year
Free cash flow 1
Adjusted free cash flow ¹
■
Buy
Improve
Sell
123
2022
2022
Melrose² Dowlais 2
3.
293
(29)
(24)
(147)
93
(72)
(23)
58
(53)
3
515
(22)
(16)
(31)
446
(222)
(36)
(15)
59
(83)
149
2022
Group
808
(51)
(40)
(178)
539
(294)
(59)
43
Year end net debt¹ of £1.14 billion, better than expectations
Particularly strong cash generation in the second half of the year
59
(136)
152
(175)
15
(8)
128
Reconciliation of net debt¹
£m
Net debt¹ brought forward
Adverse foreign exchange and other non-cash movements
Net cash flow from acquisition and disposal related activities
Free cash flow¹ in the year
Dividends paid to shareholders
Buy back of own shares
Net debt¹ 31 December 2022
Described in the glossary to the Preliminary Announcement and considered by the Board to be a key measure of performance
Melrose includes Aerospace and the continuing central cost centre; Dowlais comprises the Automotive, Powder Metallurgy and Hydrogen businesses
Calculated excluding EBITDA from equity accounted investments
2022
Group
(950)
(61)
461
(8)
(77)
(504)
(1,139)
15View entire presentation