J.P.Morgan Results Presentation Deck
Corporate ¹
SELECTED INCOME STATEMENT DATA ($MM)
Revenue
Net interest income
Noninterest revenue
Expense
Credit costs
Net income/(loss)
1 See note 1 on slide 11
Reported
$3,718
1,738
1,980
1,152
(243)
JPMORGAN CHASE & CO.
$2,640
2Q23
FR impact
$2,733
(29)
2,762
562
$2,301
ex. FR
$985
1,767
(782)
590
(243)
$339
ex. FR $ 0/(U)
1Q23
27
(27)
430
(613)
$95
2Q22
$905
1,443
(538)
384
(271)
$513
CCB
CIB
AWM Corp.
FINANCIAL PERFORMANCE (ex. FR)
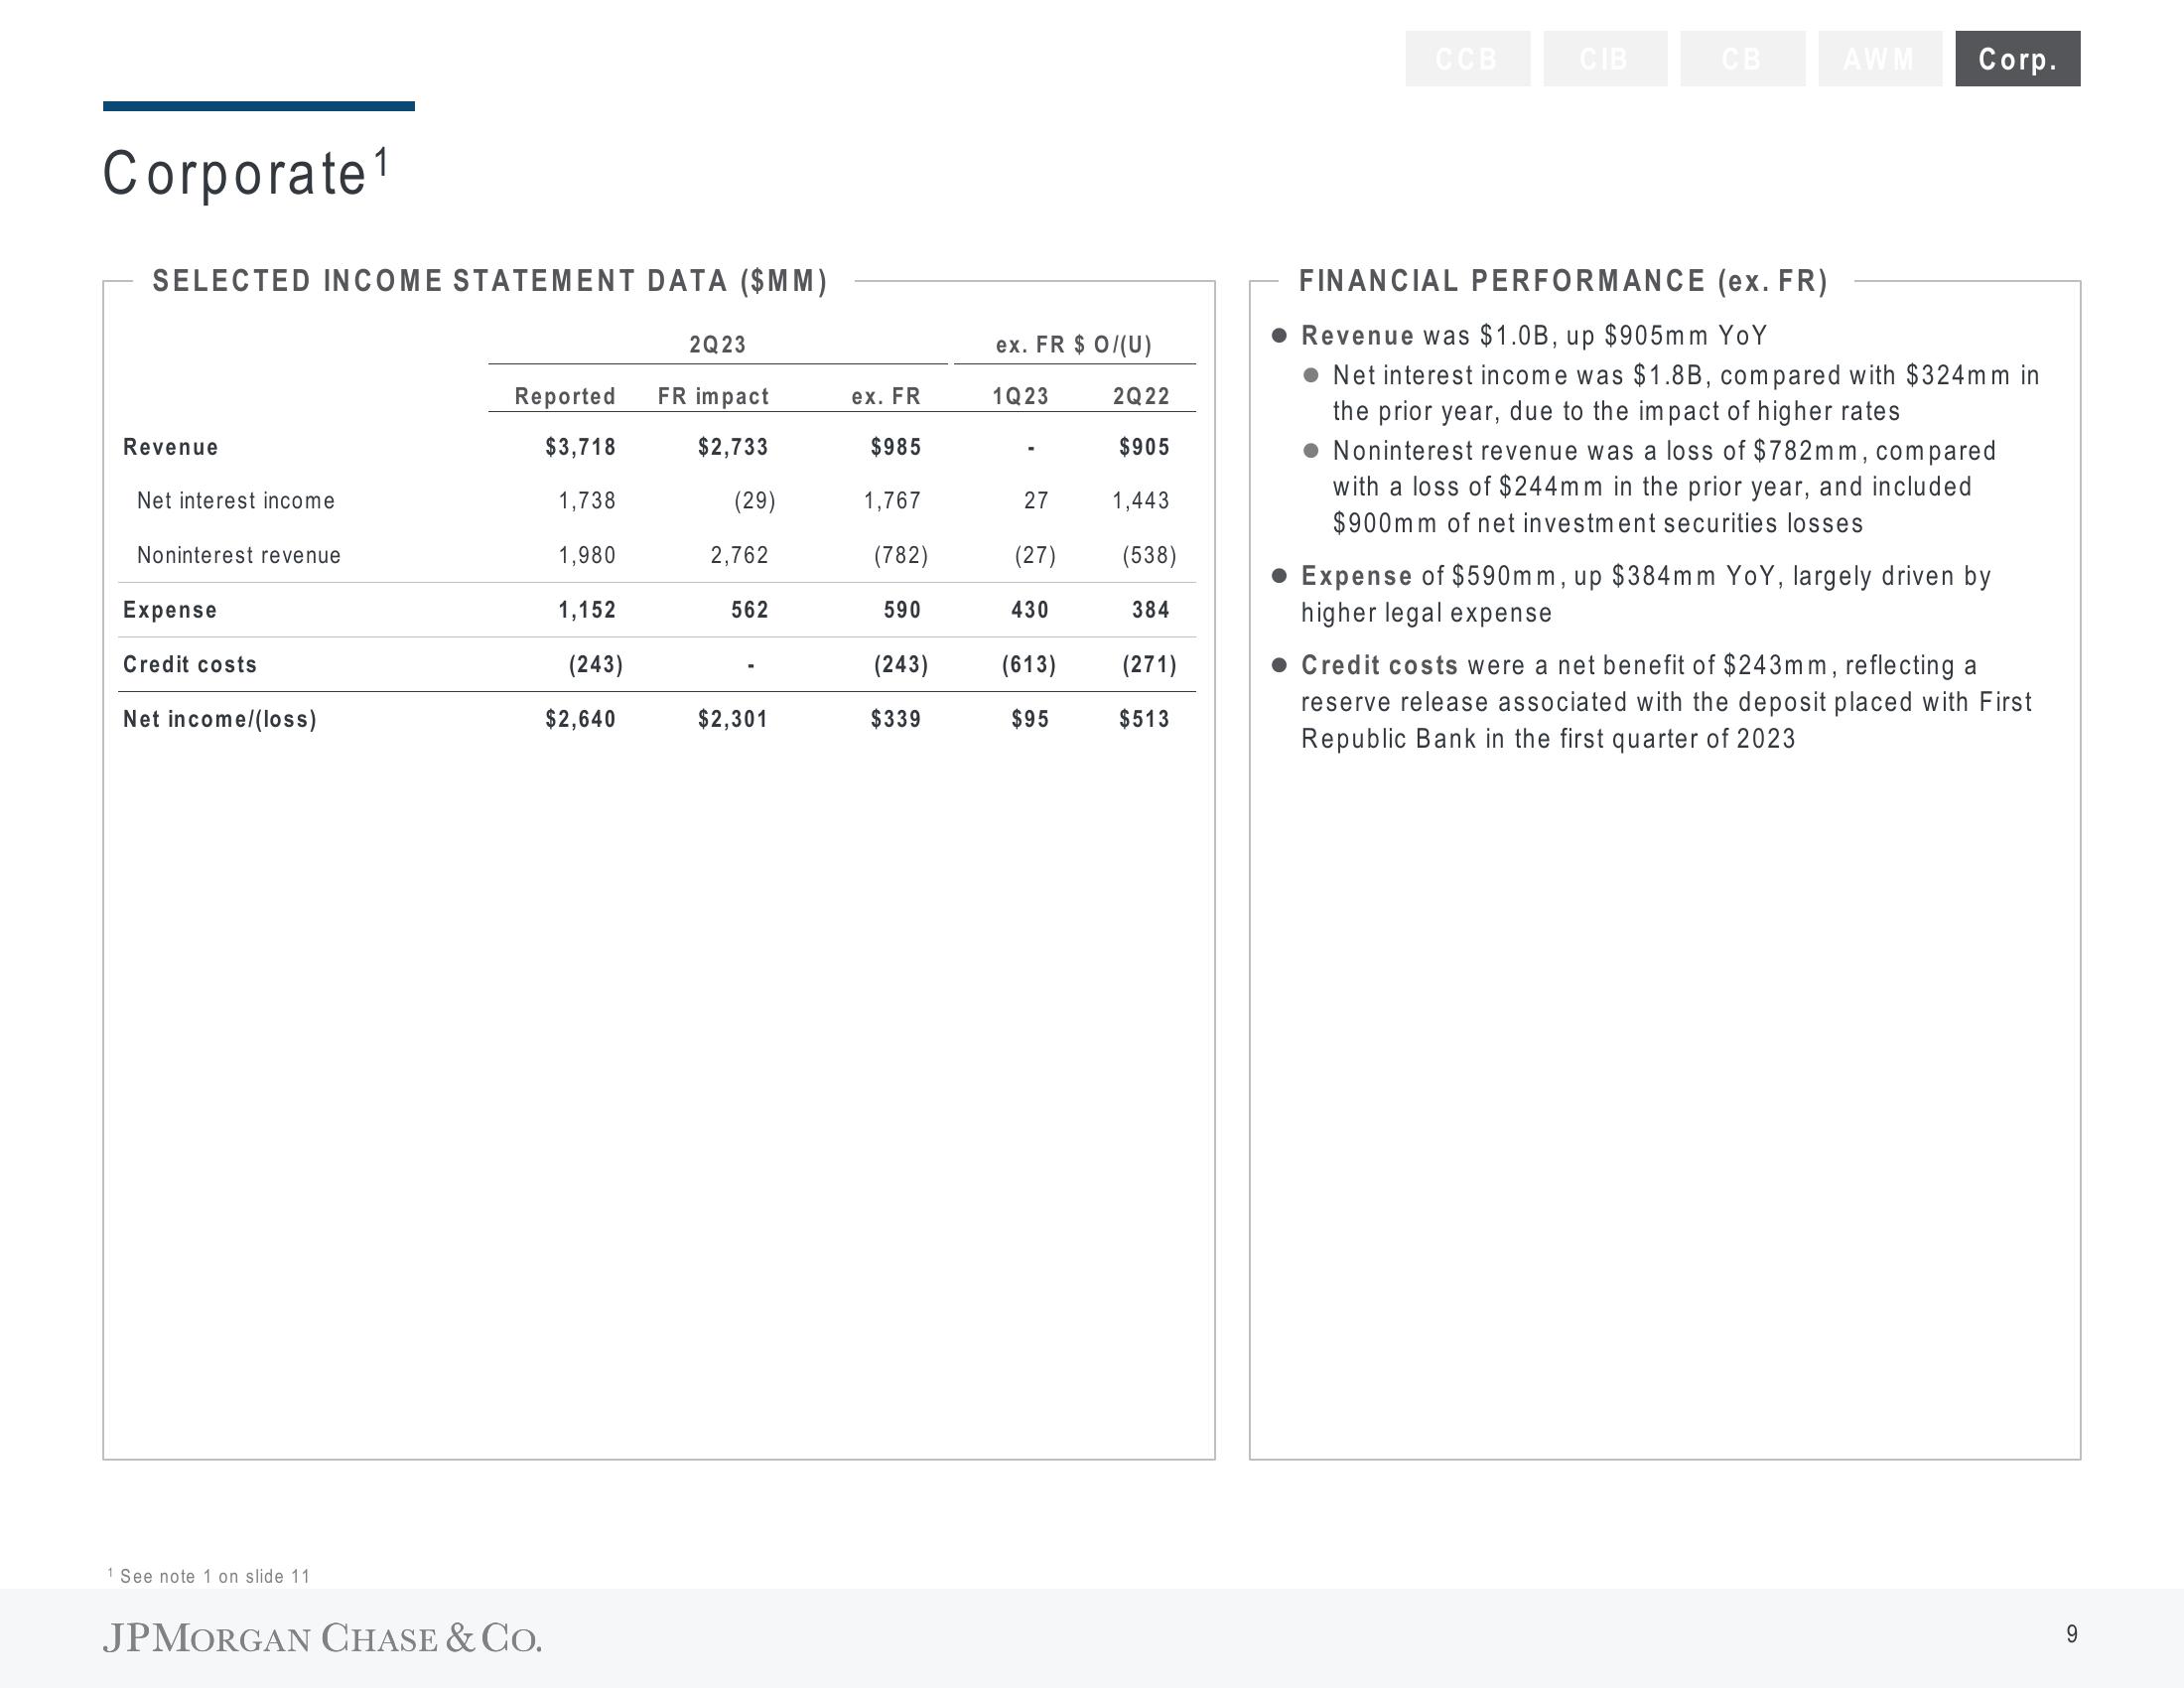
Revenue was $1.0B, up $905mm YoY
• Net interest income was $1.8B, compared with $324mm in
the prior year, due to the impact of higher rates
• Noninterest revenue was a loss of $782mm, compared
with a loss of $244mm in the prior year, and included
$900mm of net investment securities losses
Expense of $590mm, up $384mm YoY, largely driven by
higher legal expense
● Credit costs were a net benefit of $243mm, reflecting a
reserve release associated with the deposit placed with First
Republic Bank in the first quarter of 2023
9View entire presentation