BAT Results Presentation Deck
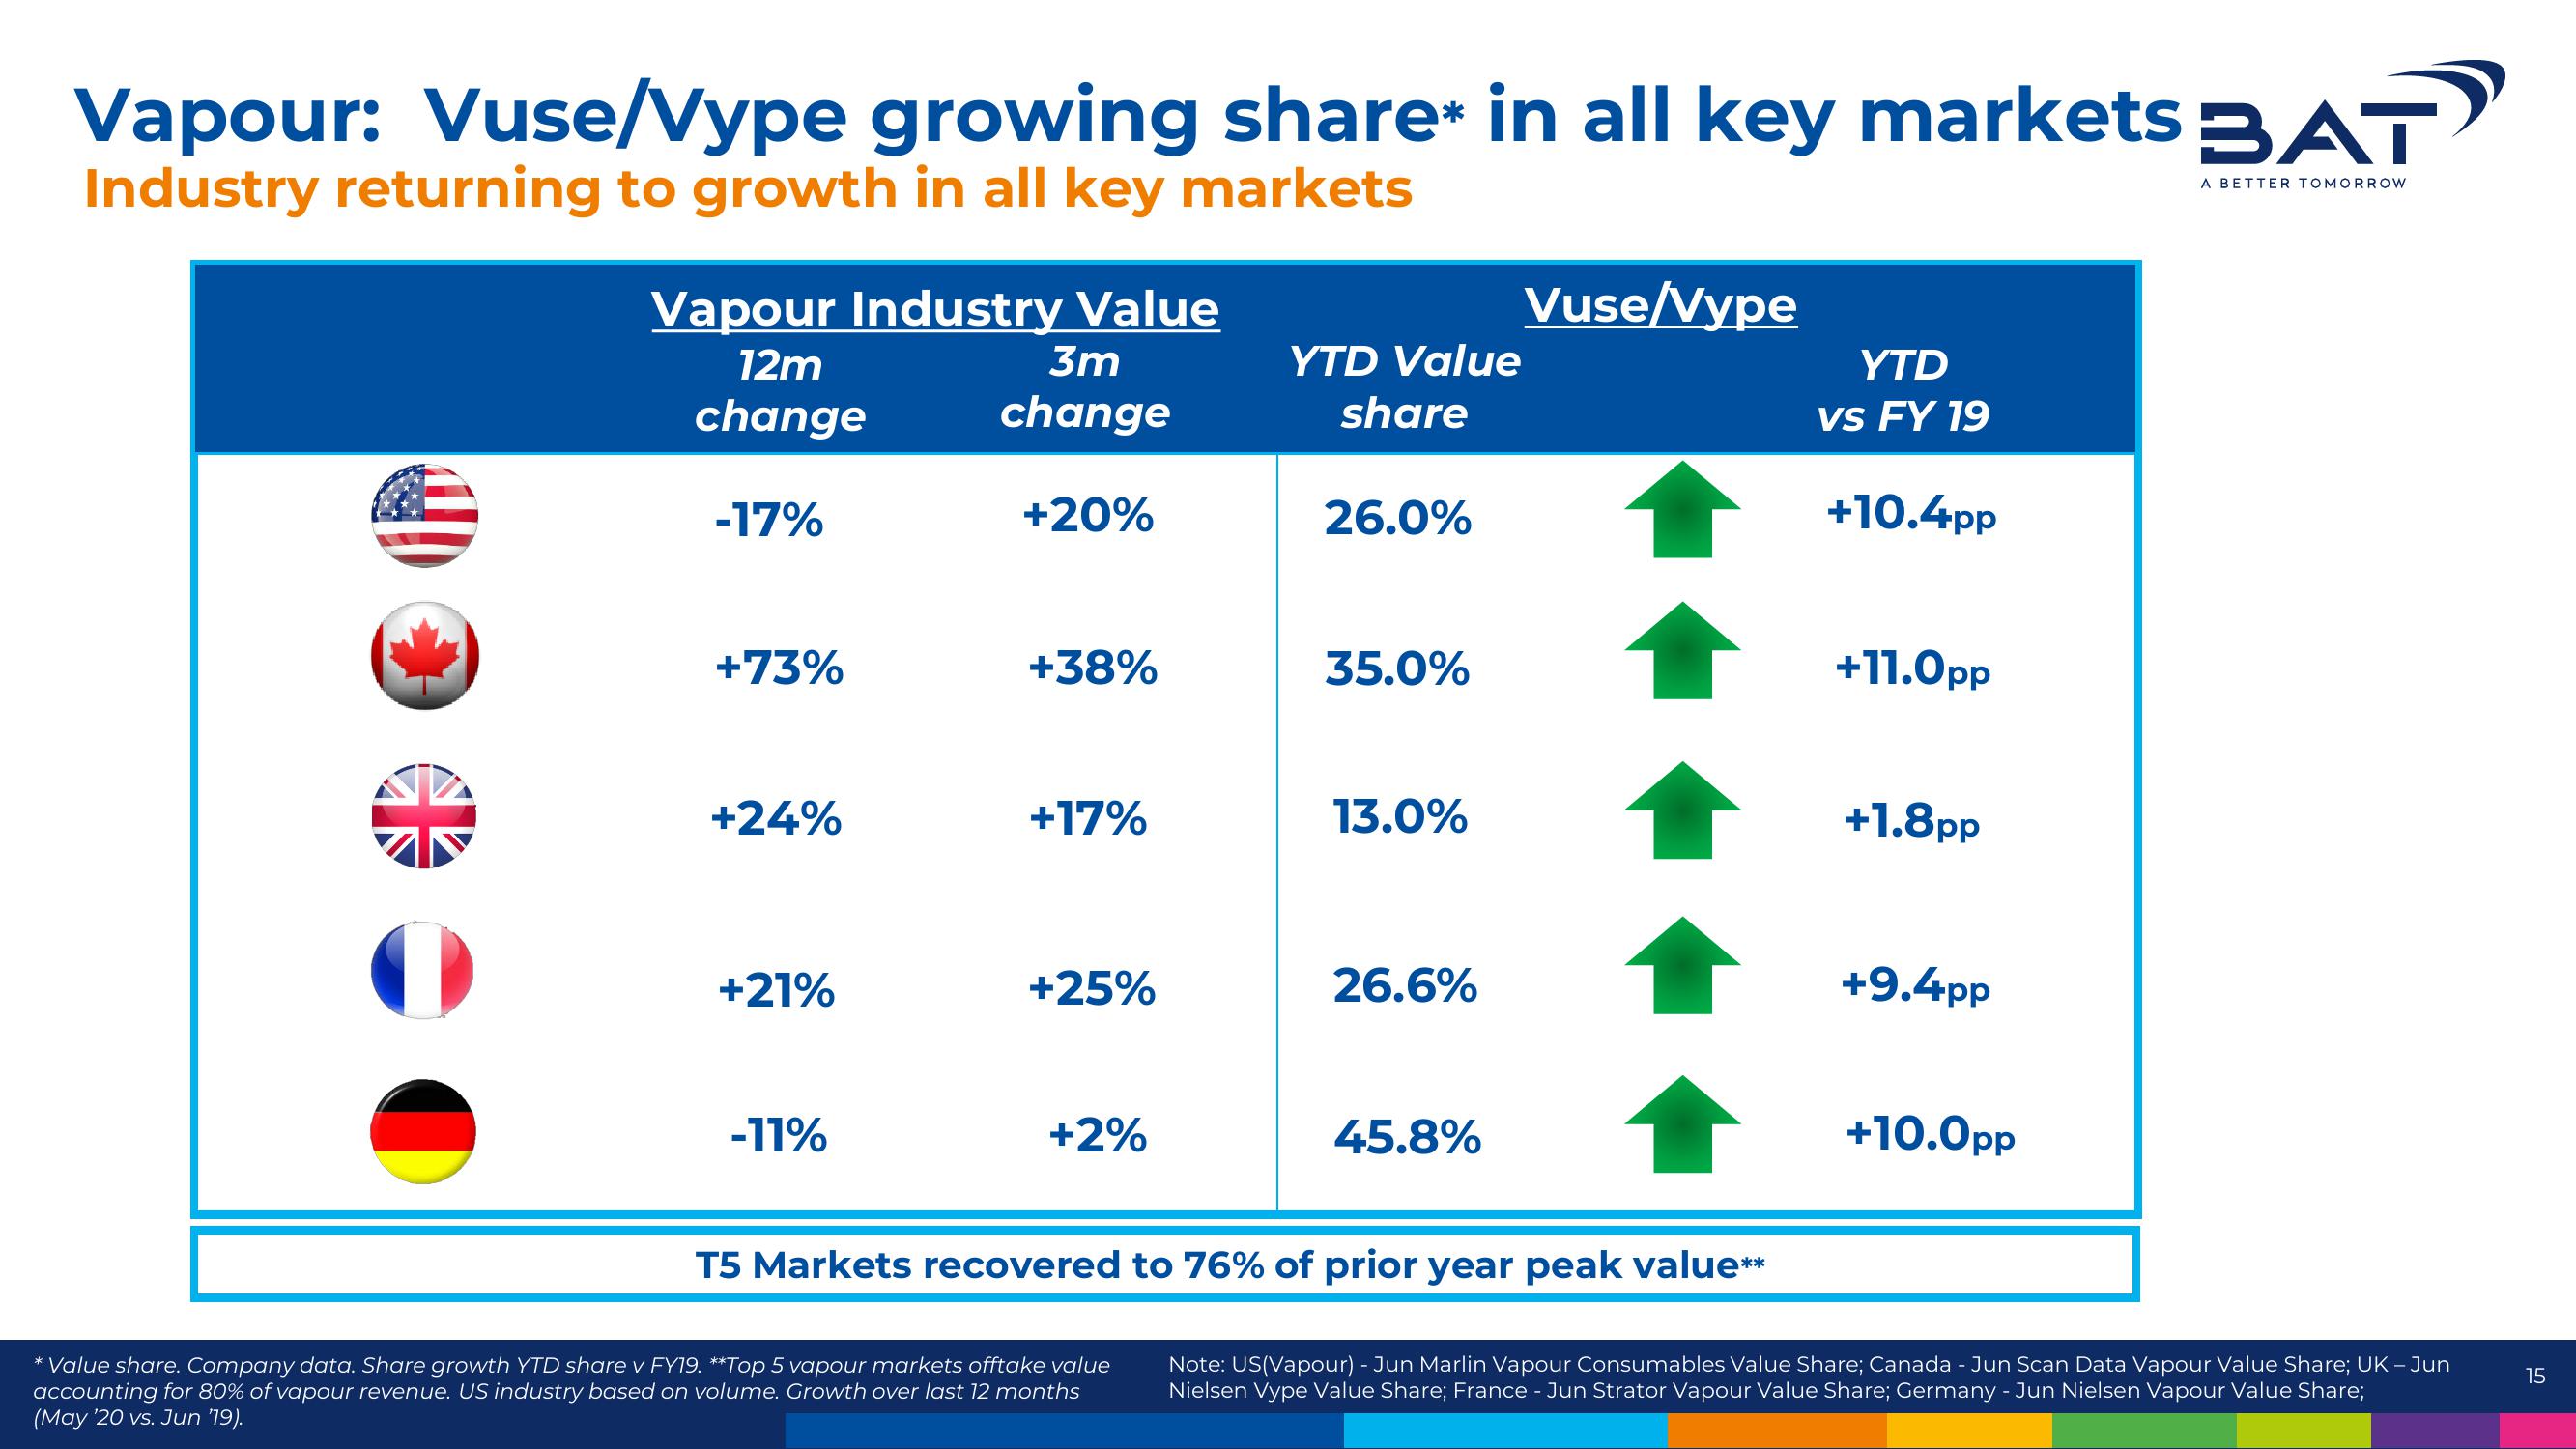
Vapour: Vuse/Vype growing share* in all key markets BAT
Industry returning to growth in all key markets
A BETTER TOMORROW
4
Vapour Industry Value
12m
change
-17%
+73%
+24%
+21%
-11%
3m
change
+20%
+38%
+17%
+25%
+2%
YTD Value
share
* Value share. Company data. Share growth YTD share v FY19. **Top 5 vapour markets offtake value
accounting for 80% of vapour revenue. US industry based on volume. Growth over last 12 months
(May '20 vs. Jun '19).
26.0%
35.0%
13.0%
26.6%
45.8%
Vuse/Vype
T5 Markets recovered to 76% of prior year peak value**
YTD
vs FY 19
+10.4pp
+11.Opp
+1.8pp
+9.4pp
+10.0pp
Note: US(Vapour) - Jun Marlin Vapour Consumables Value Share; Canada - Jun Scan Data Vapour Value Share; UK - Jun
Nielsen Vype Value Share; France - Jun Strator Vapour Value Share; Germany - Jun Nielsen Vapour Value Share;
15View entire presentation