Oatly Results Presentation Deck
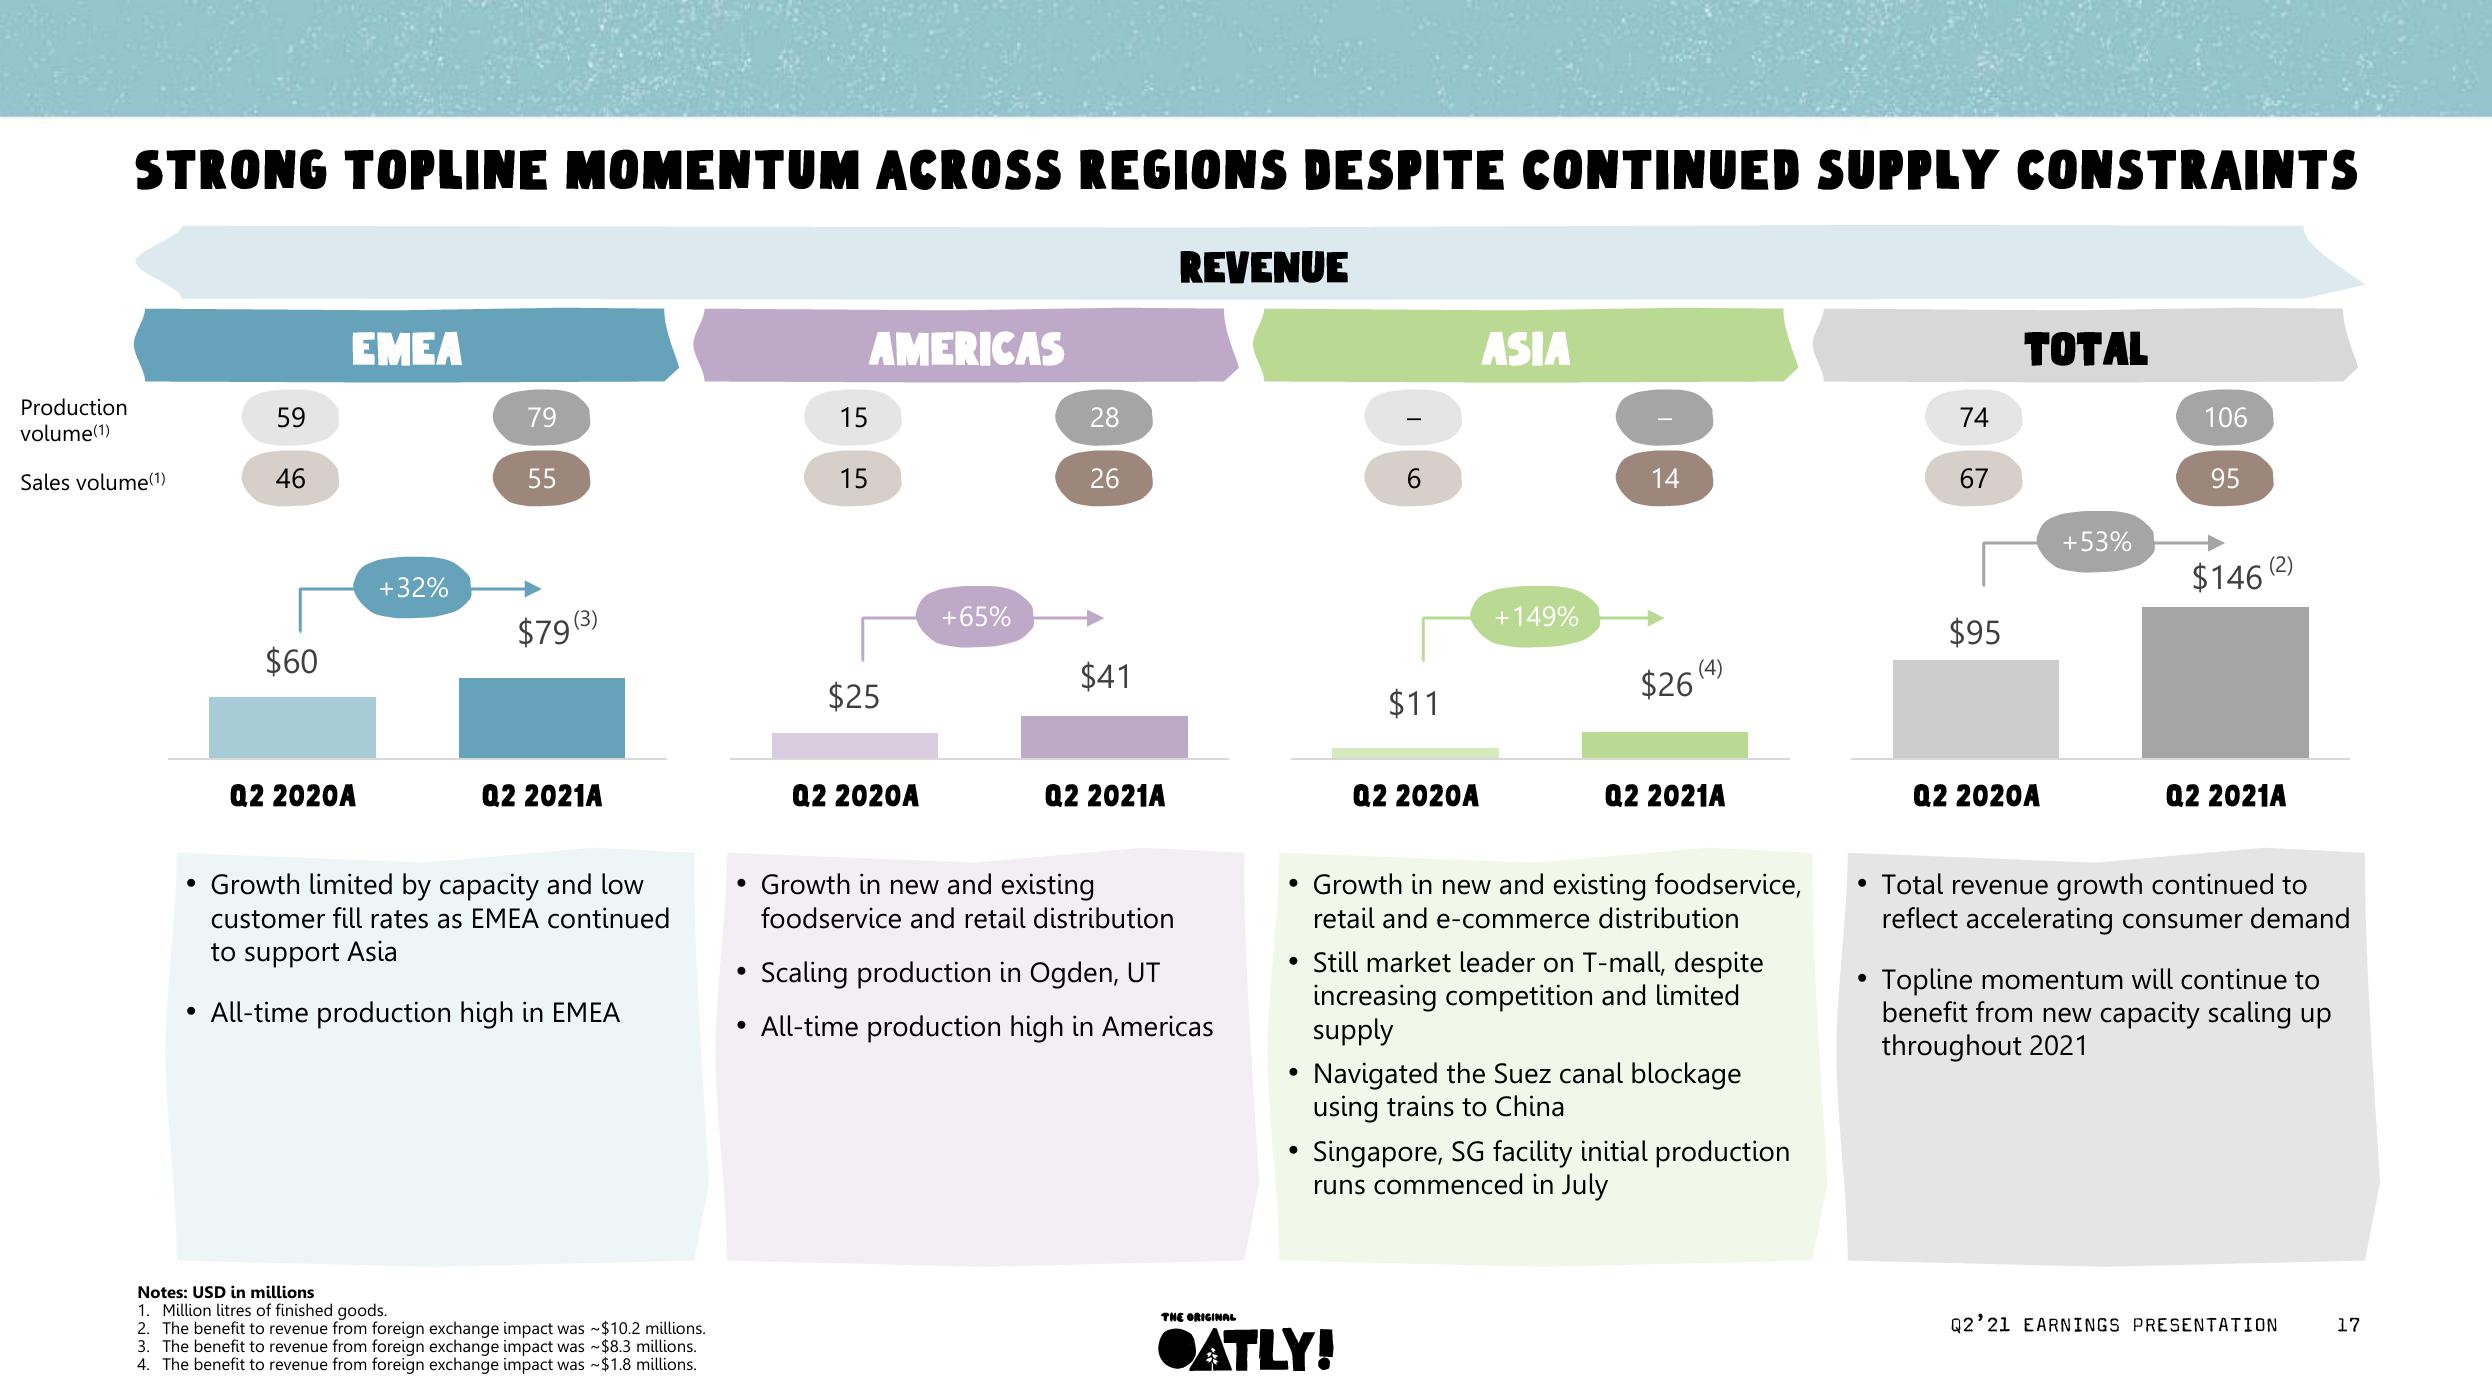
STRONG TOPLINE MOMENTUM ACROSS REGIONS DESPITE CONTINUED SUPPLY CONSTRAINTS
Production
volume(1)
Sales volume(1)
59
46
$60
EMEA
Q2 2020A
+32%
79
55
$79(3)
Q2 2021A
• Growth limited by capacity and low
customer fill rates as EMEA continued
to support Asia
• All-time production high in EMEA
Notes: USD in millions
1. Million litres of finished goods.
2. The benefit to revenue from foreign exchange impact was ~$10.2 millions.
3. The benefit to revenue from foreign exchange impact was ~$8.3 millions.
4. The benefit to revenue from foreign exchange impact was ~$1.8 millions.
●
AMERICAS
●
15
15
$25
Q2 2020A
+65%
28
26
$41
• Growth in new and existing
foodservice and retail distribution
Q2 2021A
REVENUE
Scaling production in Ogden, UT
All-time production high in Americas
THE ORIGINAL
●
●
●
●
6
$11
Q2 2020A
ASIA
●ATLY!
+149%
14
$26
(4)
Q2 2021A
Growth in new and existing foodservice,
retail and e-commerce distribution
Still market leader on T-mall, despite
increasing competition and limited
supply
Navigated the Suez canal blockage
using trains to China
Singapore, SG facility initial production
runs commenced in July
●
74
67
$95
TOTAL
Q2 2020A
+53%
106
95
$146 (2)
Q2 2021A
Total revenue growth continued to
reflect accelerating consumer demand
Topline momentum will continue to
benefit from new capacity scaling up
throughout 2021
Q2'21 EARNINGS PRESENTATION
17View entire presentation