Credit Suisse Investment Banking Pitch Book
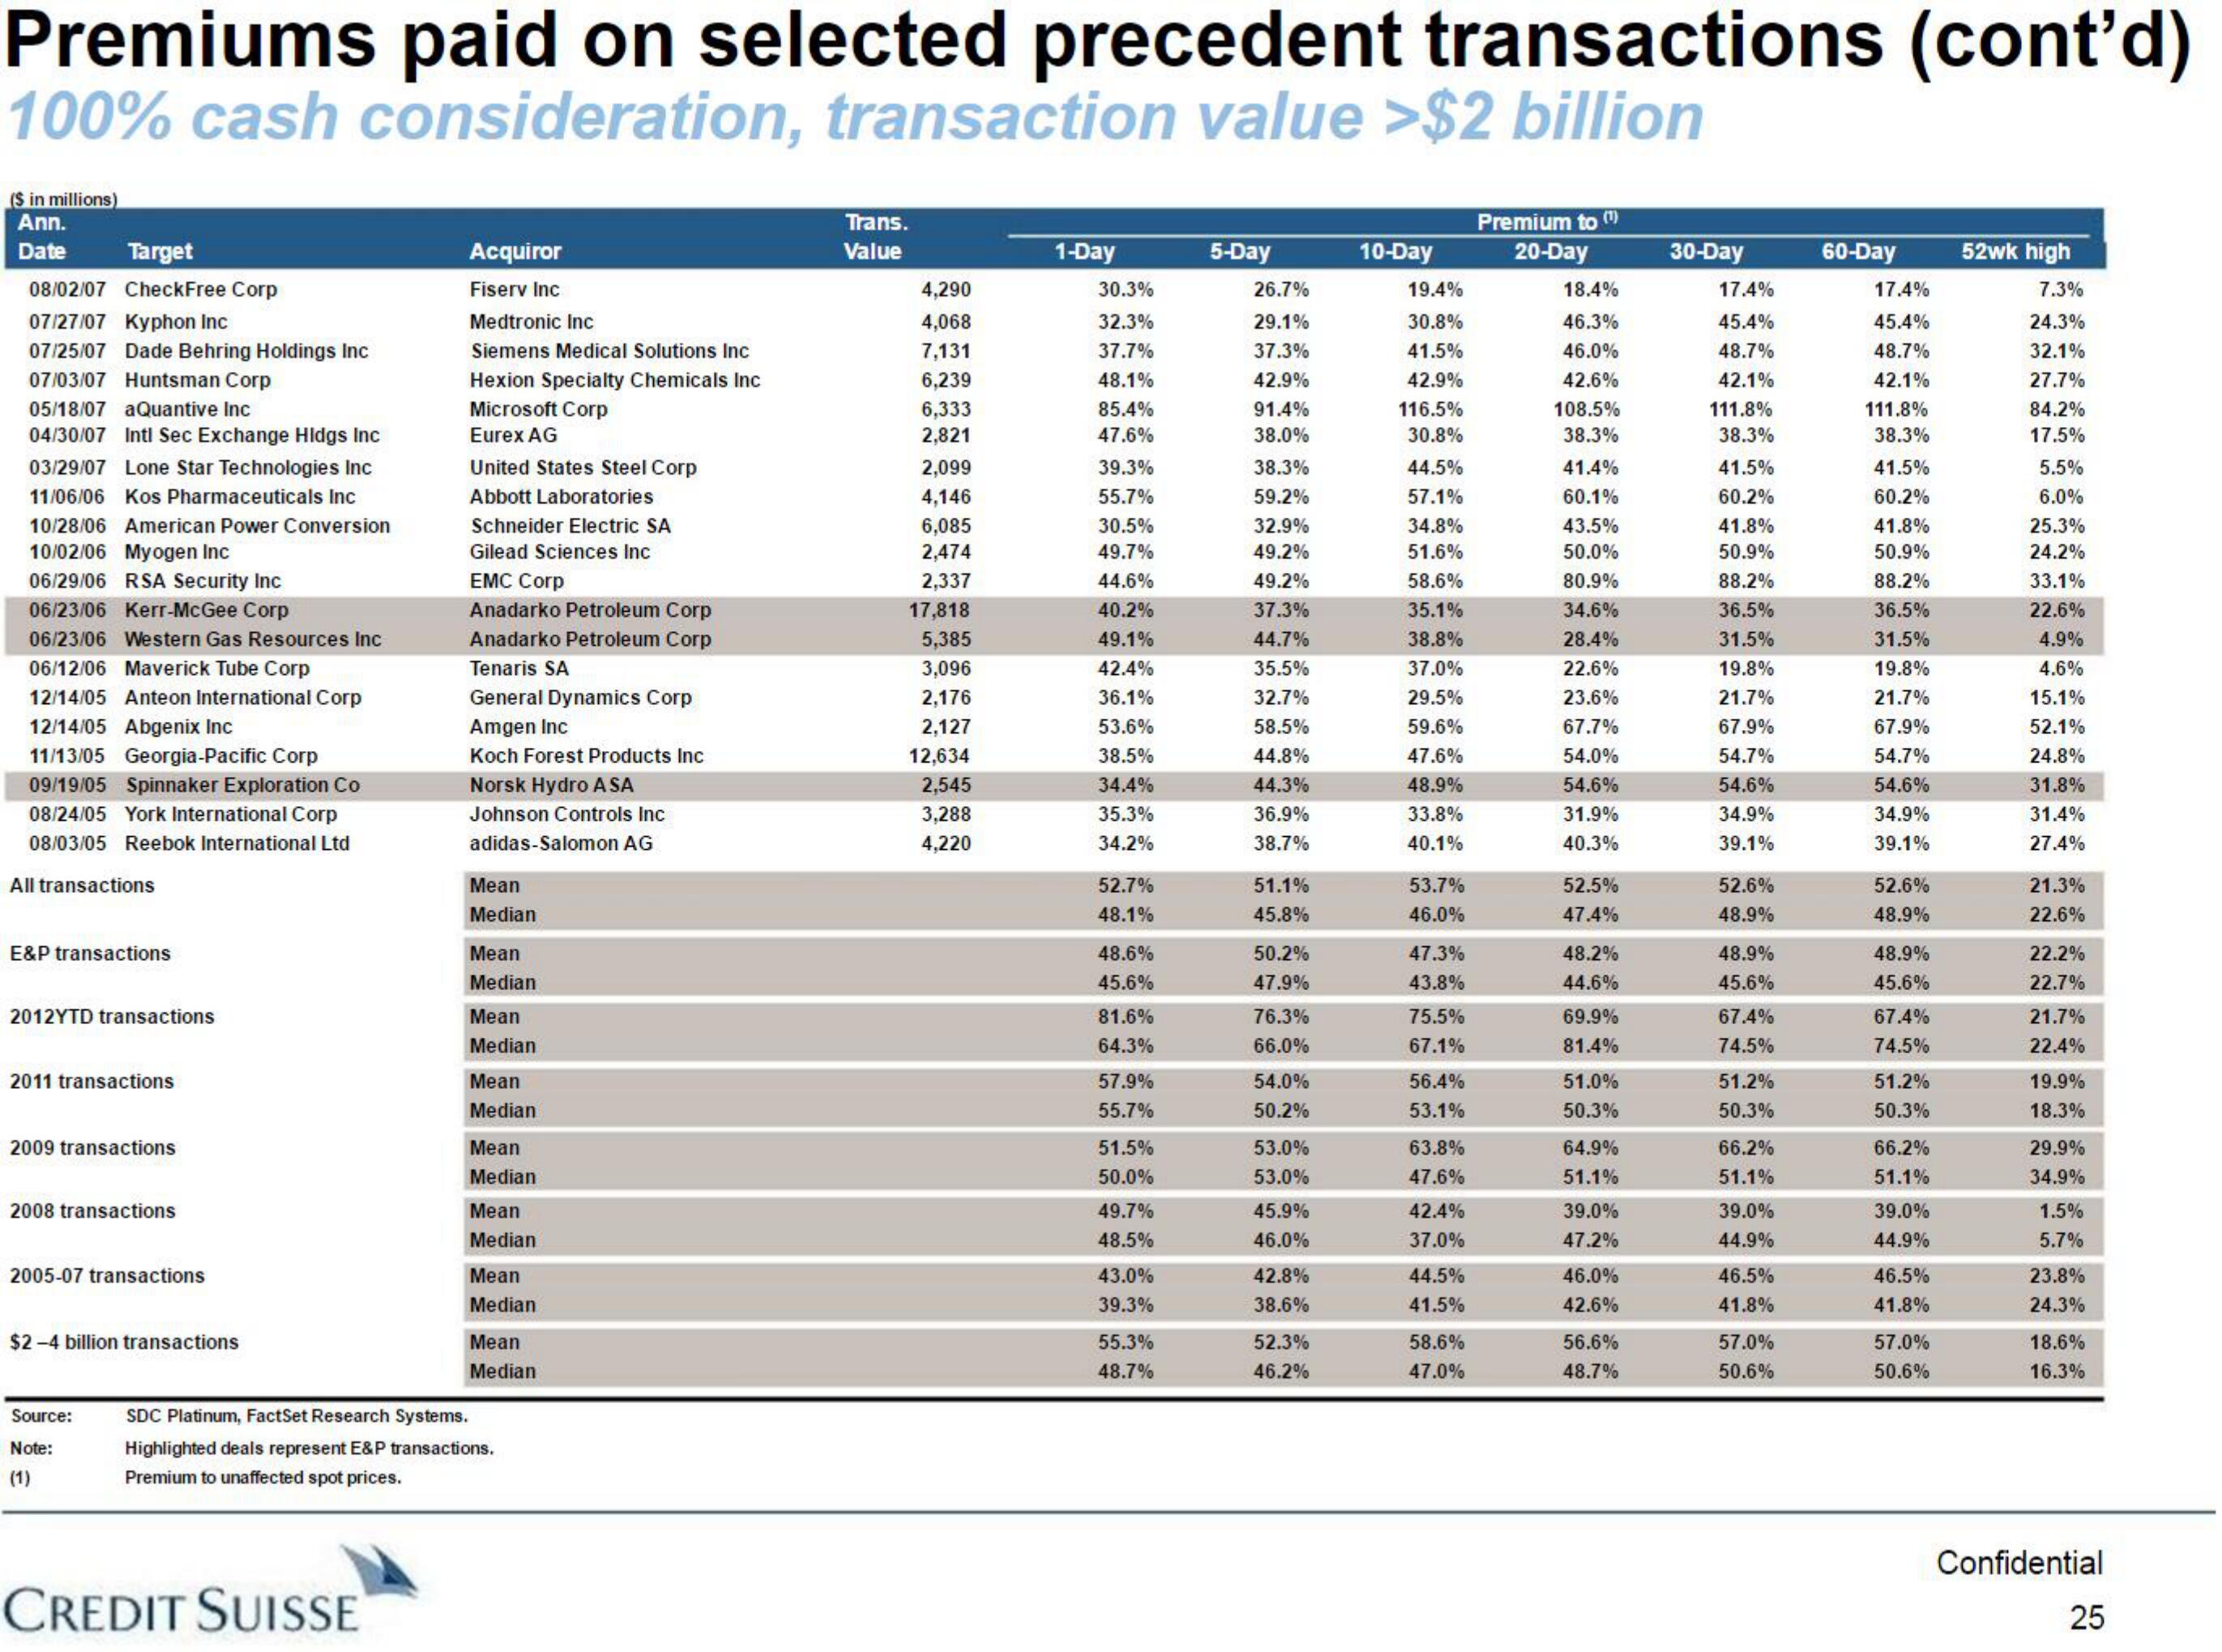
Premiums paid on selected precedent transactions (cont'd)
100% cash consideration, transaction value >$2 billion
($ in millions)
Ann.
Date Target
08/02/07 CheckFree Corp
07/27/07 Kyphon Inc
07/25/07 Dade Behring Holdings Inc
07/03/07 Huntsman Corp
05/18/07 aQuantive Inc
04/30/07 Intl Sec Exchange Hidgs Inc
03/29/07 Lone Star Technologies Inc
11/06/06 Kos Pharmaceuticals Inc
10/28/06 American Power Conversion
10/02/06 Myogen Inc
06/29/06 RSA Security Inc
06/23/06 Kerr-McGee Corp
06/23/06 Western Gas Resources Inc
06/12/06 Maverick Tube Corp
12/14/05 Anteon International Corp
12/14/05 Abgenix Inc
11/13/05 Georgia-Pacific Corp
09/19/05 Spinnaker Exploration Co
08/24/05 York International Corp
08/03/05 Reebok International Ltd
All transactions
E&P transactions
2012YTD transactions
2011 transactions
2009 transactions
2008 transactions
2005-07 transactions
$2-4 billion transactions
Source:
Note:
(1)
Acquiror
Fiserv Inc
Medtronic Inc
Siemens Medical Solutions Inc
Hexion Specialty Chemicals Inc
Microsoft Corp
Eurex AG
Credit SuisSE
United States Steel Corp
Abbott Laboratories
Schneider Electric SA
Gilead Sciences Inc
EMC Corp
Anadarko Petroleum Corp
Anadarko Petroleum Corp
Tenaris SA
General Dynamics Corp
Amgen Inc
Koch Forest Products Inc
Norsk Hydro A SA
Johnson Controls Inc
adidas-Salomon AG
Mean
Median
Mean
Median
Mean
Median
Mean
Median
Mean
Median
Mean
Median
Mean
Median
Mean
Median
SDC Platinum, FactSet Research Systems.
Highlighted deals represent E&P transactions.
Premium to unaffected spot prices.
Trans.
Value
4,290
4,068
7,131
6,239
6,333
2,821
2,099
4,146
6,085
2,474
2,337
17,818
5,385
3,096
2,176
2,127
12,634
2,545
3,288
4,220
1-Day
30.3%
32.3%
37.7%
48.1%
85.4%
47.6%
39.3%
55.7%
30.5%
49.7%
44.6%
40.2%
49.1%
42.4%
36.1%
53.6%
38.5%
34.4%
35.3%
34.2%
52.7%
48.1%
48.6%
45.6%
81.6%
64.3%
57.9%
55.7%
51.5%
50.0%
49.7%
48.5%
43.0%
39.3%
55.3%
48.7%
5-Day
26.7%
29.1%
37.3%
42.9%
91.4%
38.0%
38.3%
59.2%
32.9%
49.2%
49.2%
37.3%
44.7%
35.5%
32.7%
58.5%
44.8%
44.3%
36.9%
38.7%
51.1%
45.8%
50.2%
47.9%
76.3%
66.0%
54.0%
50.2%
53.0%
53.0%
45.9%
46.0%
42.8%
38.6%
52.3%
46.2%
10-Day
19.4%
30.8%
41.5%
42.9%
116.5%
30.8%
44.5%
57.1%
34.8%
51.6%
58.6%
35.1%
38.8%
37.0%
29.5%
59.6%
47.6%
48.9%
33.8%
40.1%
53.7%
46.0%
47.3%
43.8%
75.5%
67.1%
56.4%
53.1%
63.8%
47.6%
42.4%
37.0%
44.5%
41.5%
58.6%
47.0%
Premium to (¹)
20-Day
18.4%
46.3%
46.0%
42.6%
108.5%
38.3%
41.4%
60.1%
43.5%
50.0%
80.9%
34.6%
28.4%
22.6%
23.6%
67.7%
54.0%
54.6%
31.9%
40.3%
52.5%
47.4%
48.2%
44.6%
69.9%
81.4%
51.0%
50.3%
64.9%
51.1%
39.0%
47.2%
46.0%
42.6%
56.6%
48.7%
30-Day
17.4%
45.4%
48.7%
42.1%
111.8%
38.3%
41.5%
60.2%
41.8%
50.9%
88.2%
36.5%
31.5%
19.8%
21.7%
67.9%
54.7%
54.6%
34.9%
39.1%
52.6%
48.9%
48.9%
45.6%
67.4%
74.5%
51.2%
50.3%
66.2%
51.1%
39.0%
44.9%
46.5%
41.8%
57.0%
50.6%
60-Day
17.4%
45.4%
48.7%
42.1%
111.8%
38.3%
41.5%
60.2%
41.8%
50.9%
88.2%
36.5%
31.5%
19.8%
21.7%
67.9%
54.7%
54.6%
34.9%
39.1%
52.6%
48.9%
48.9%
45.6%
67.4%
74.5%
51.2%
50.3%
66.2%
51.1%
39.0%
44.9%
46.5%
41.8%
57.0%
50.6%
52wk high
7.3%
24.3%
32.1%
27.7%
84.2%
17.5%
5.5%
6.0%
25.3%
24.2%
33.1%
22.6%
4.9%
4.6%
15.1%
52.1%
24.8%
31.8%
31.4%
27.4%
21.3%
22.6%
22.2%
22.7%
21.7%
22.4%
19.9%
18.3%
29.9%
34.9%
1.5%
5.7%
23.8%
24.3%
18.6%
16.3%
Confidential
25View entire presentation