Tesla Results Presentation Deck
7
OPERATIONAL SUMMARY
(Unaudited)
Model 3/Y production
Other models production
Total production
Model 3/Y deliveries
Other models deliveries
Total deliveries
of which subject to operating lease accounting
Total end of quarter operating lease vehicle count
Global vehicle inventory (days of supply)(¹)
Solar deployed (MW)
Storage deployed (MWh)
Tesla locations
Mobile service fleet
Supercharger stations
Supercharger connectors
Q4-2022
419,088
20,613
439,701
388,131
17,147
405,278
15,184
140,667
13
100
2,462
963
1,584
4,678
42,419
Q1-2023
421,371
19,437
440,808
412,180
10,695
422,875
22,357
153,988
15
67
3,889
1,000
1,692
4,947
45,169
Q2-2023
460,211
19,489
479,700
446,915
19,225
466,140
21,883
168,058
16
66
3,653
1,068
1,769
5,265
48,082
Q3-2023
416,800
13,688
430,488
419,074
15,985
435,059
17,423
176,231
16
49
3,980
1,129
1,846
5,595
51,105
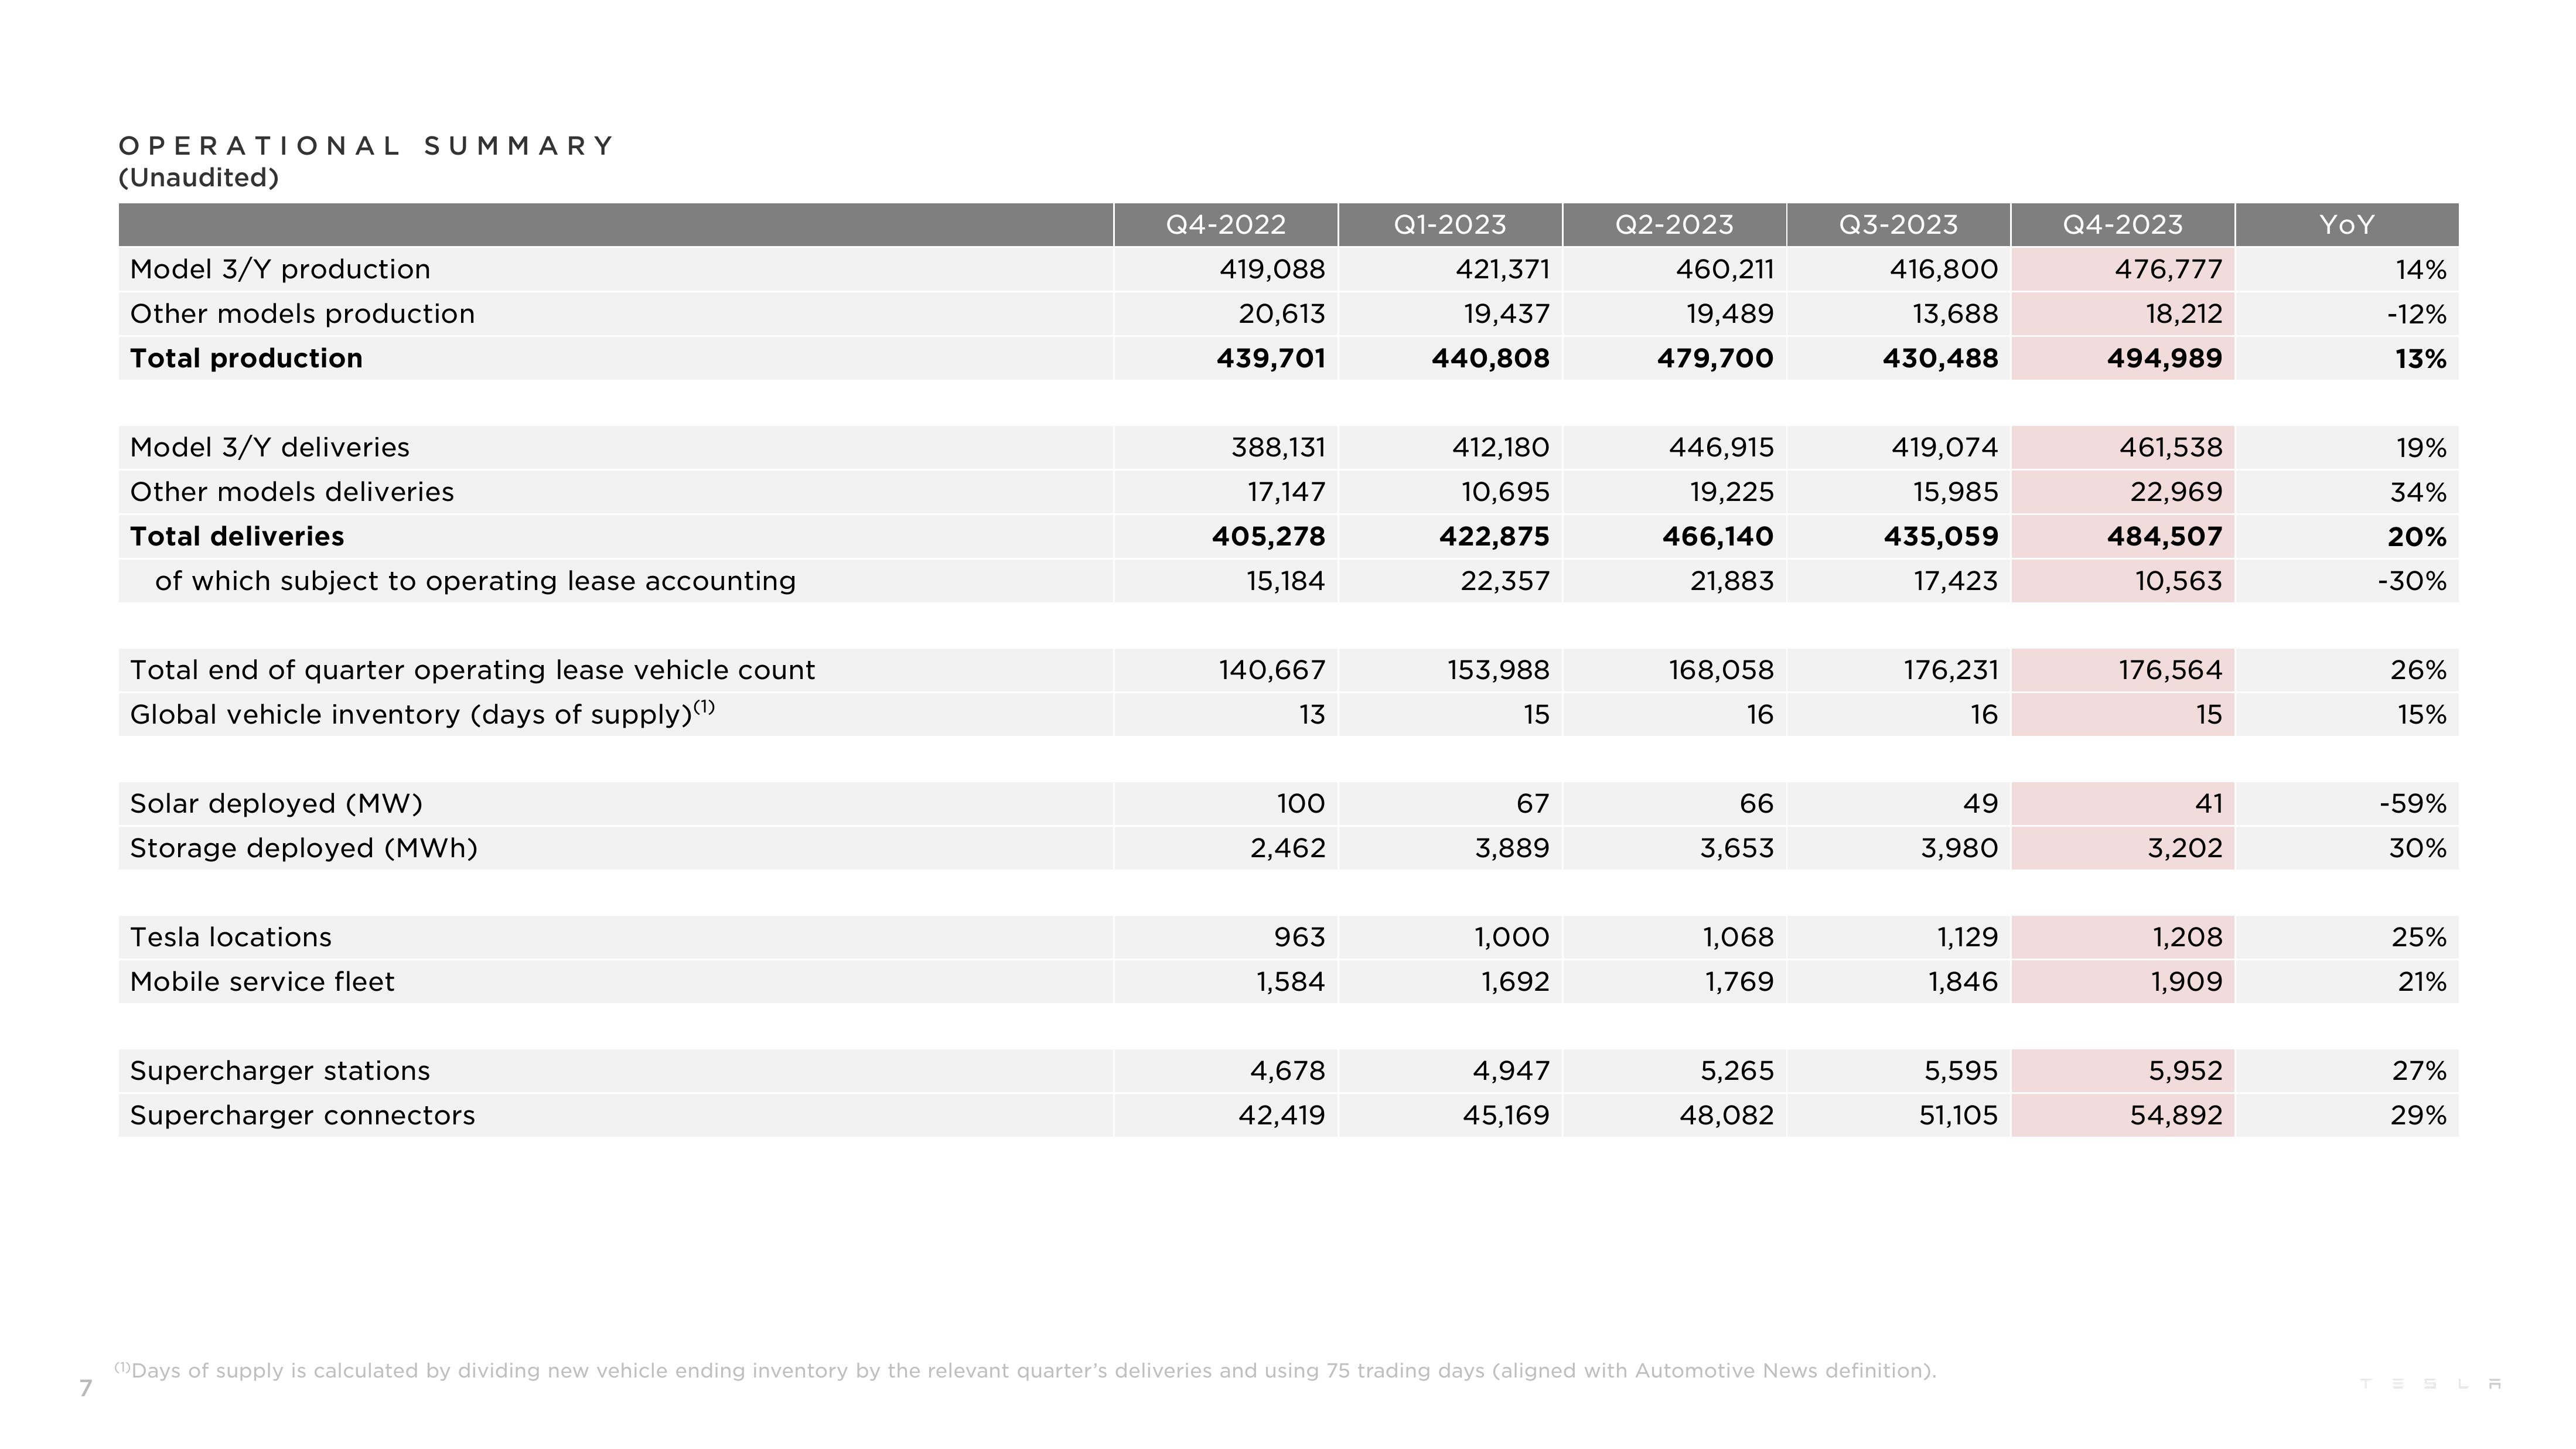
(Days of supply is calculated by dividing new vehicle ending inventory by the relevant quarter's deliveries and using 75 trading days (aligned with Automotive News definition).
Q4-2023
476,777
18,212
494,989
461,538
22,969
484,507
10,563
176,564
15
41
3,202
1,208
1,909
5,952
54,892
YoY
14%
-12%
13%
19%
34%
20%
-30%
26%
15%
-59%
30%
25%
21%
27%
29%
TESLAView entire presentation