Liberty Global Results Presentation Deck
VMO2 JV RECONCILIATIONS - REVENUE (CONTINUED)
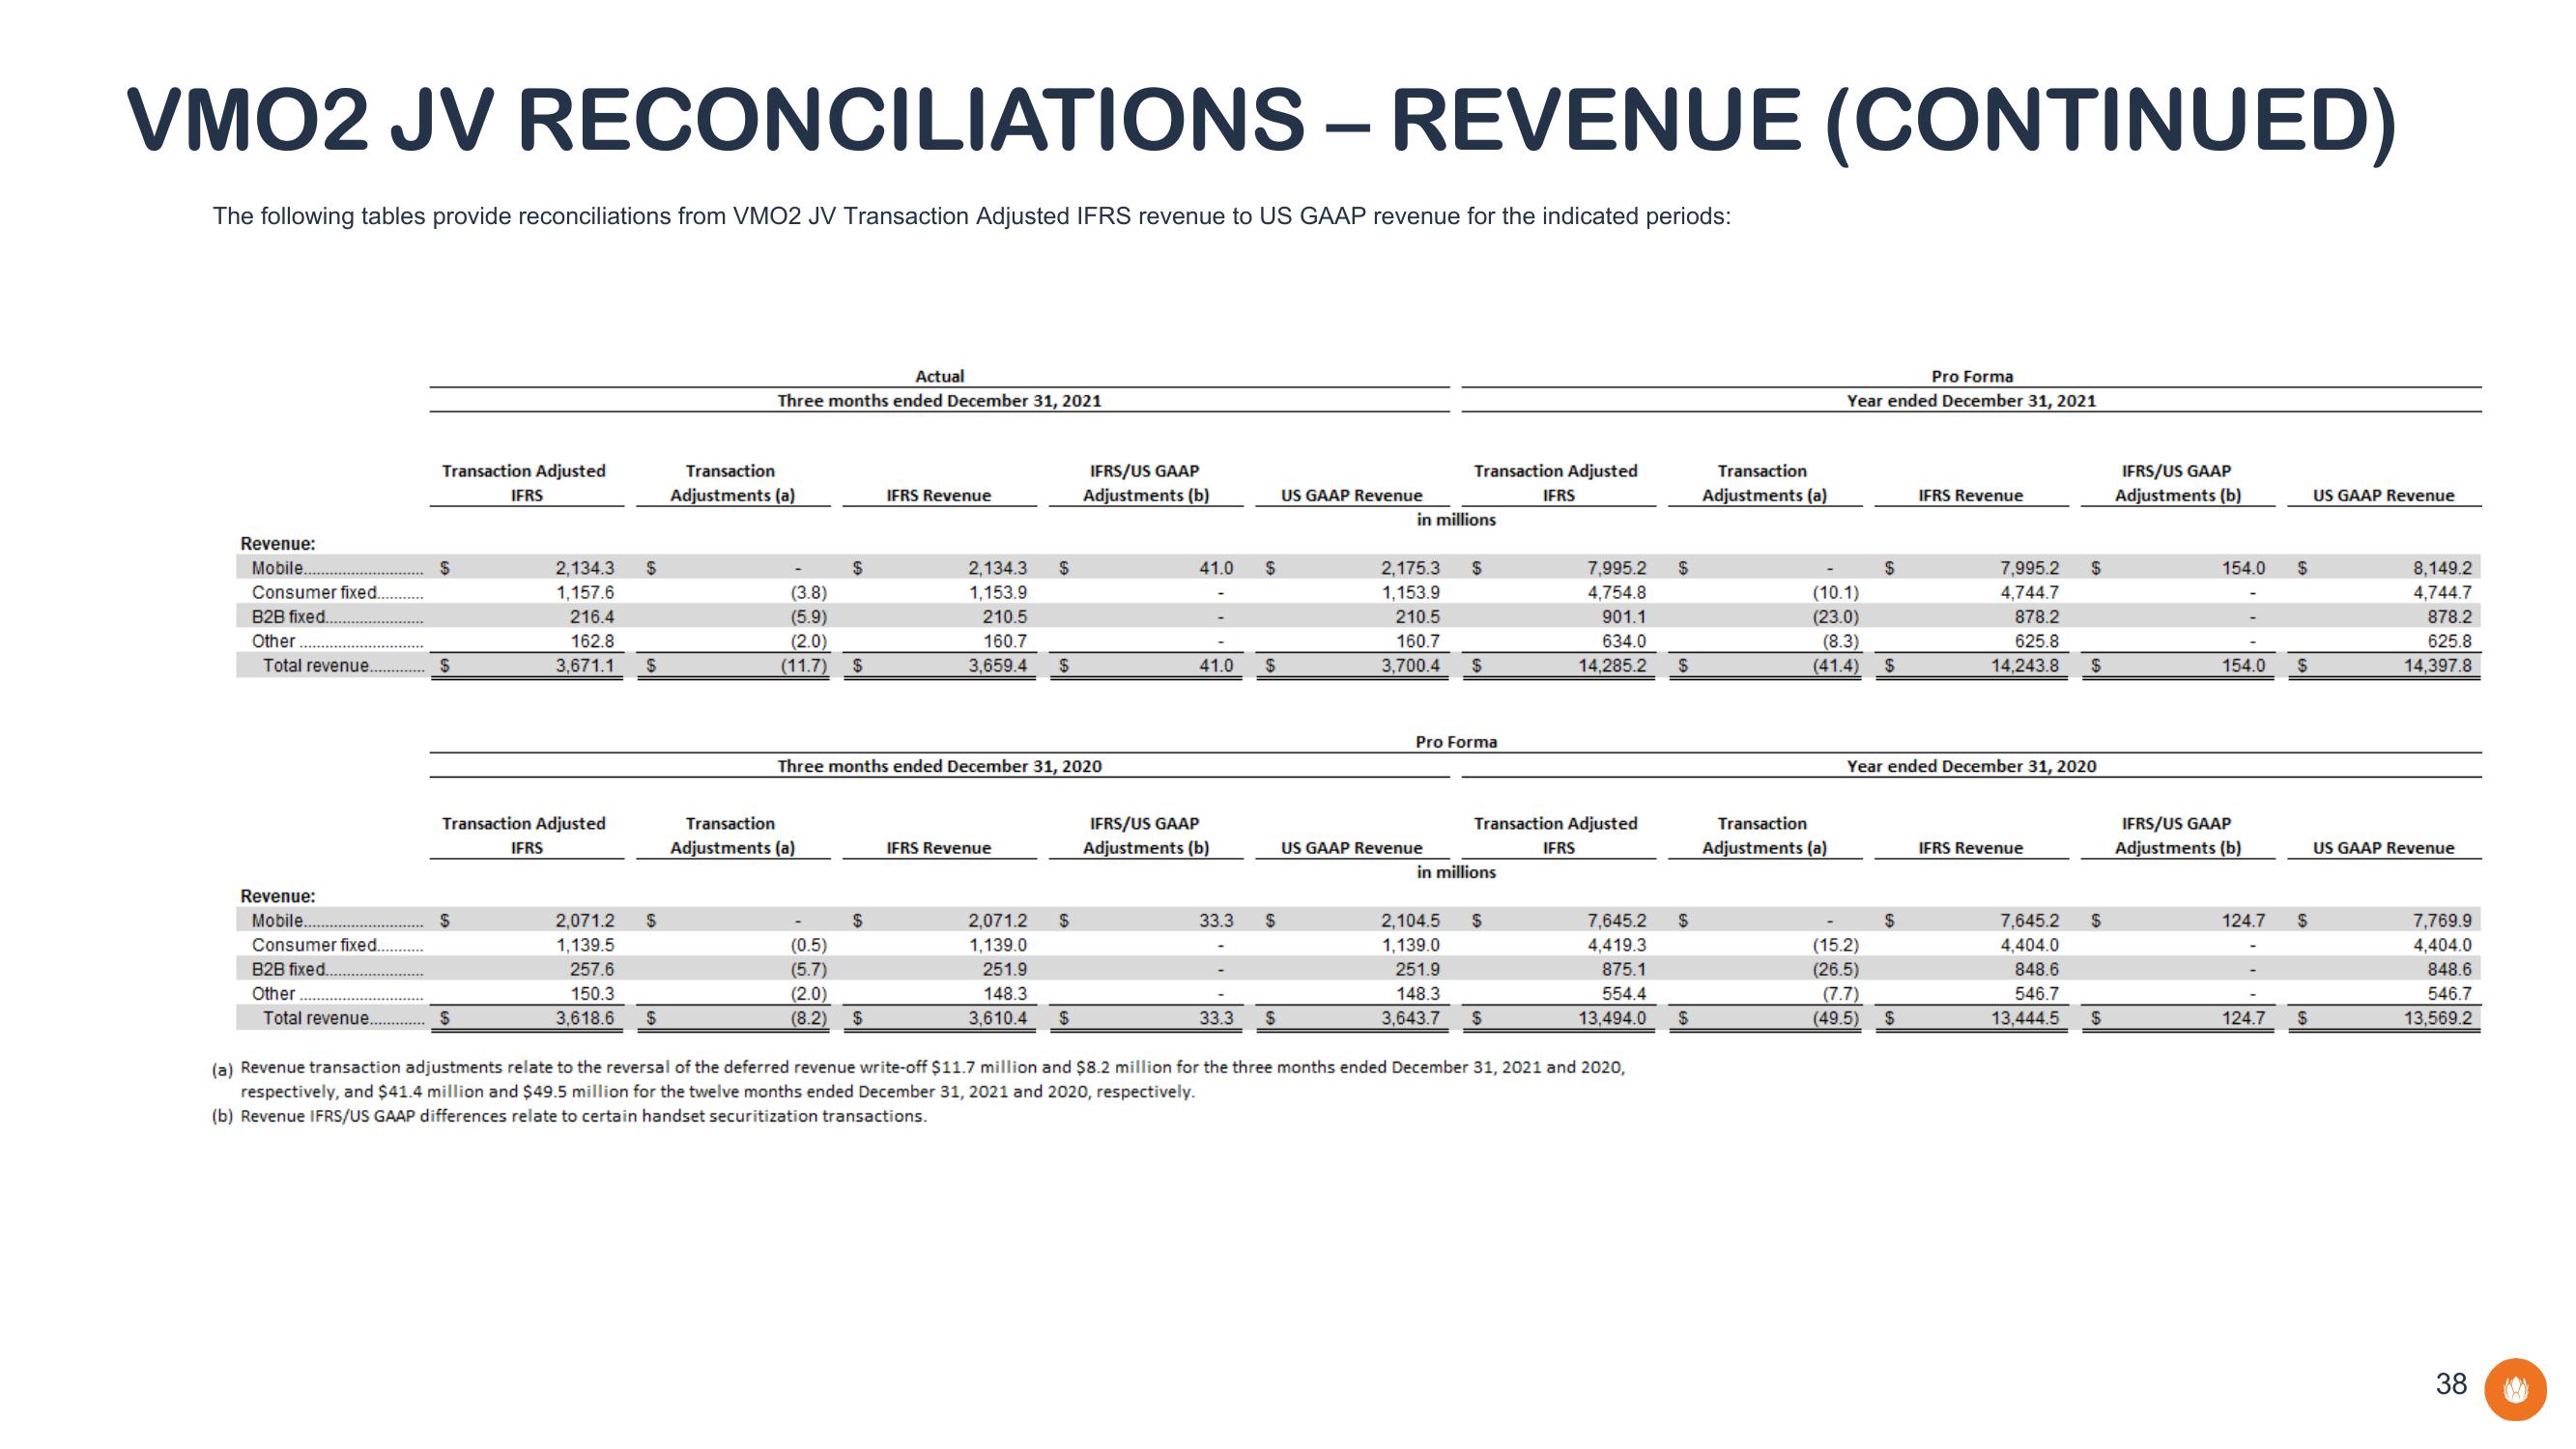
The following tables provide reconciliations from VMO2 JV Transaction Adjusted IFRS revenue to US GAAP revenue for the indicated periods:
Revenue:
Mobile.
Consumer fixed.
B2B fixed..
Other.....
Total revenue.
Revenue:
Mobile.
Consumer fixed..
B2B fixed.
Other
Total revenue.
Transaction Adjusted
$
$
IFRS
Transaction Adjusted
$
2,134.3 $
1,157.6
216.4
162.8
3,671.1
IFRS
$
2,071.2 $
1,139.5
257.6
150.3
3,618.6
$
Actual
Three months ended December 31, 2021
Transaction
Adjustments (a)
(3.8)
(5.9)
(2.0)
(11.7) $
$
Transaction
Adjustments (a)
(0.5)
(5.7)
$
IFRS Revenue
(2.0)
(8.2) $
2,134.3
1,153.9
210.5
160.7
3,659.4
Three months ended December 31, 2020
$
IFRS Revenue
$
IFRS/US GAAP
Adjustments (b)
2,071.2 $
1,139.0
251.9
148.3
3,610.4 $
41.0
41.0
IFRS/US GAAP
Adjustments (b)
33.3
$
$
$
33.3 $
US GAAP Revenue
Transaction Adjusted
in millions
2,175.3 $
1,153.9
210.5
160.7
3,700.4 $
Pro Forma
US GAAP Revenue
in millions
Transaction Adjusted
$
IFRS
2,104.5
1,139.0
251.9
148.3
3,643.7 $
7,995.2
4,754.8
901.1
634.0
14,285.2
IFRS
7,645.2
4,419.3
875.1
554.4
13,494.0
(a) Revenue transaction adjustments relate to the reversal of the deferred revenue write-off $11.7 million and $8.2 million for the three months ended December 31, 2021 and 2020,
respectively, and $41.4 million and $49.5 million for the twelve months ended December 31, 2021 and 2020, respectively.
(b) Revenue IFRS/US GAAP differences relate to certain handset securitization transactions.
$
$
$
$
Transaction
Adjustments (a)
Pro Forma
Year ended December 31, 2021
(10.1)
(23.0)
(8.3)
(41.4)
Transaction
Adjustments (a)
$
(15.2)
(26.5)
(7.7)
(49.5)
$
$
IFRS Revenue
Year ended December 31, 2020
$
7,995.2
4,744.7
878.2
625.8
14,243.8 $
IFRS Revenue
$
7,645.2
4,404.0
848.6
546.7
13,444.5
$
$
IFRS/US GAAP
Adjustments (b)
154.0
154.0
IFRS/US GAAP
Adjustments (b)
124.7
124.7
$
$
$
$
US GAAP Revenue
8,149.2
4,744.7
878.2
625.8
14,397.8
US GAAP Revenue
7,769.9
4,404.0
848.6
546.7
13,569.2
38View entire presentation