Bridge Investment Group Results Presentation Deck
Appendix
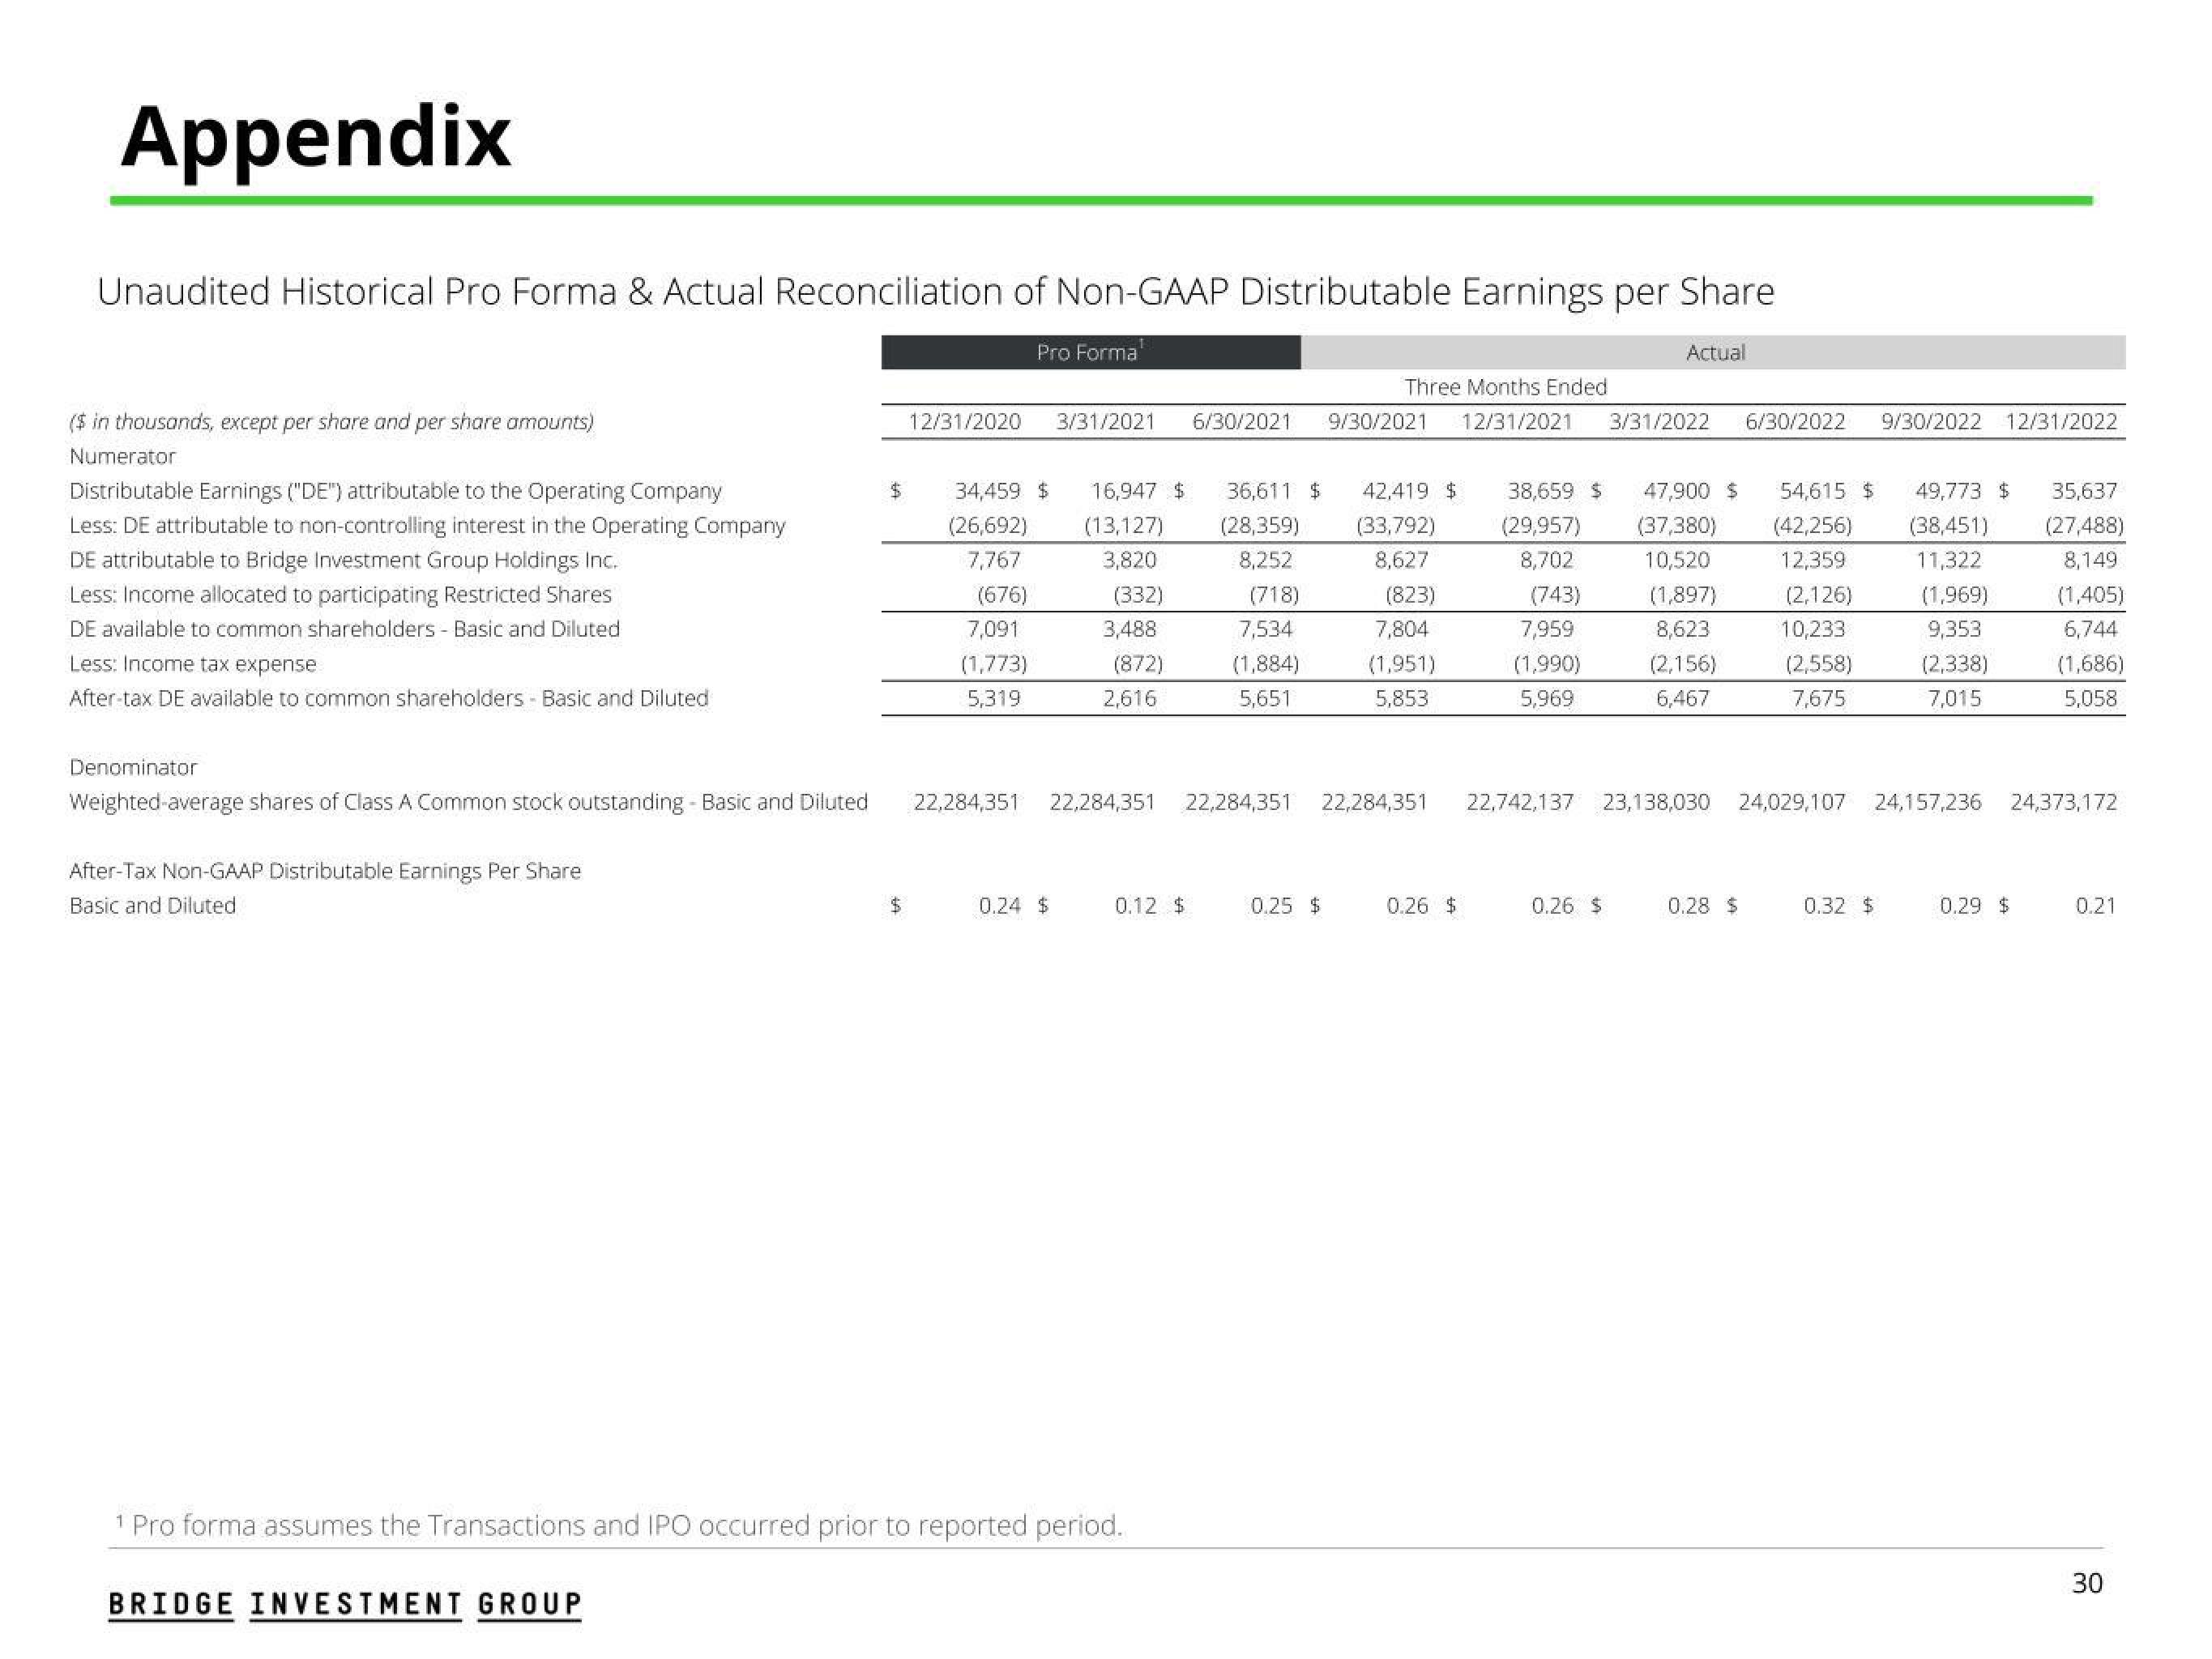
Unaudited Historical Pro Forma & Actual Reconciliation of Non-GAAP Distributable Earnings per Share
Actual
($ in thousands, except per share and per share amounts)
Numerator
Distributable Earnings ("DE") attributable to the Operating Company
Less: DE attributable to non-controlling interest in the Operating Company
DE attributable to Bridge Investment Group Holdings Inc.
Less: Income allocated to participating Restricted Shares
DE available to common shareholders - Basic and Diluted
Less: Income tax expense
After-tax DE available to common shareholders - Basic and Diluted
Denominator
Weighted average shares of Class A Common stock outstanding - Basic and Diluted
After-Tax Non-GAAP Distributable Earnings Per Share
Basic and Diluted
$
BRIDGE INVESTMENT GROUP
$
12/31/2020
Pro Forma
34,459 $
(26,692)
7,767
(676)
7,091
(1,773)
5,319
3/31/2021 6/30/2021
0.24 $
16,947 $
(13,127)
3,820
(332)
3,488
(872)
2,616
22,284,351 22,284,351 22,284,351
0.12 $
¹ Pro forma assumes the Transactions and IPO occurred prior to reported period.
36,611 $
(28,359)
8,252
(718)
7,534
(1,884)
5,651
Three Months Ended
9/30/2021 12/31/2021 3/31/2022
0.25 $
42,419 $
(33,792)
8,627
(823)
7,804
(1,951)
5,853
22,284,351
0.26 $
38,659 $ 47,900 $
(29,957) (37,380)
8,702 10,520
(1,897)
8,623
(743)
7,959
(1,990)
5,969
(2,156)
6,467
0.26 $
6/30/2022 9/30/2022 12/31/2022
0.28 $
54,615 $
(42,256)
12,359
(2,126)
10,233
(2,558)
7,675
49,773 $
(38,451)
11,322
22,742,137 23,138,030 24,029,107 24,157,236 24,373,172
0.32 $
(1,969)
9,353
(2,338)
7,015
35,637
(27,488)
8,149
(1,405)
6,744
(1,686)
5,058
0.29 $
0.21
30View entire presentation