MoneyLion Results Presentation Deck
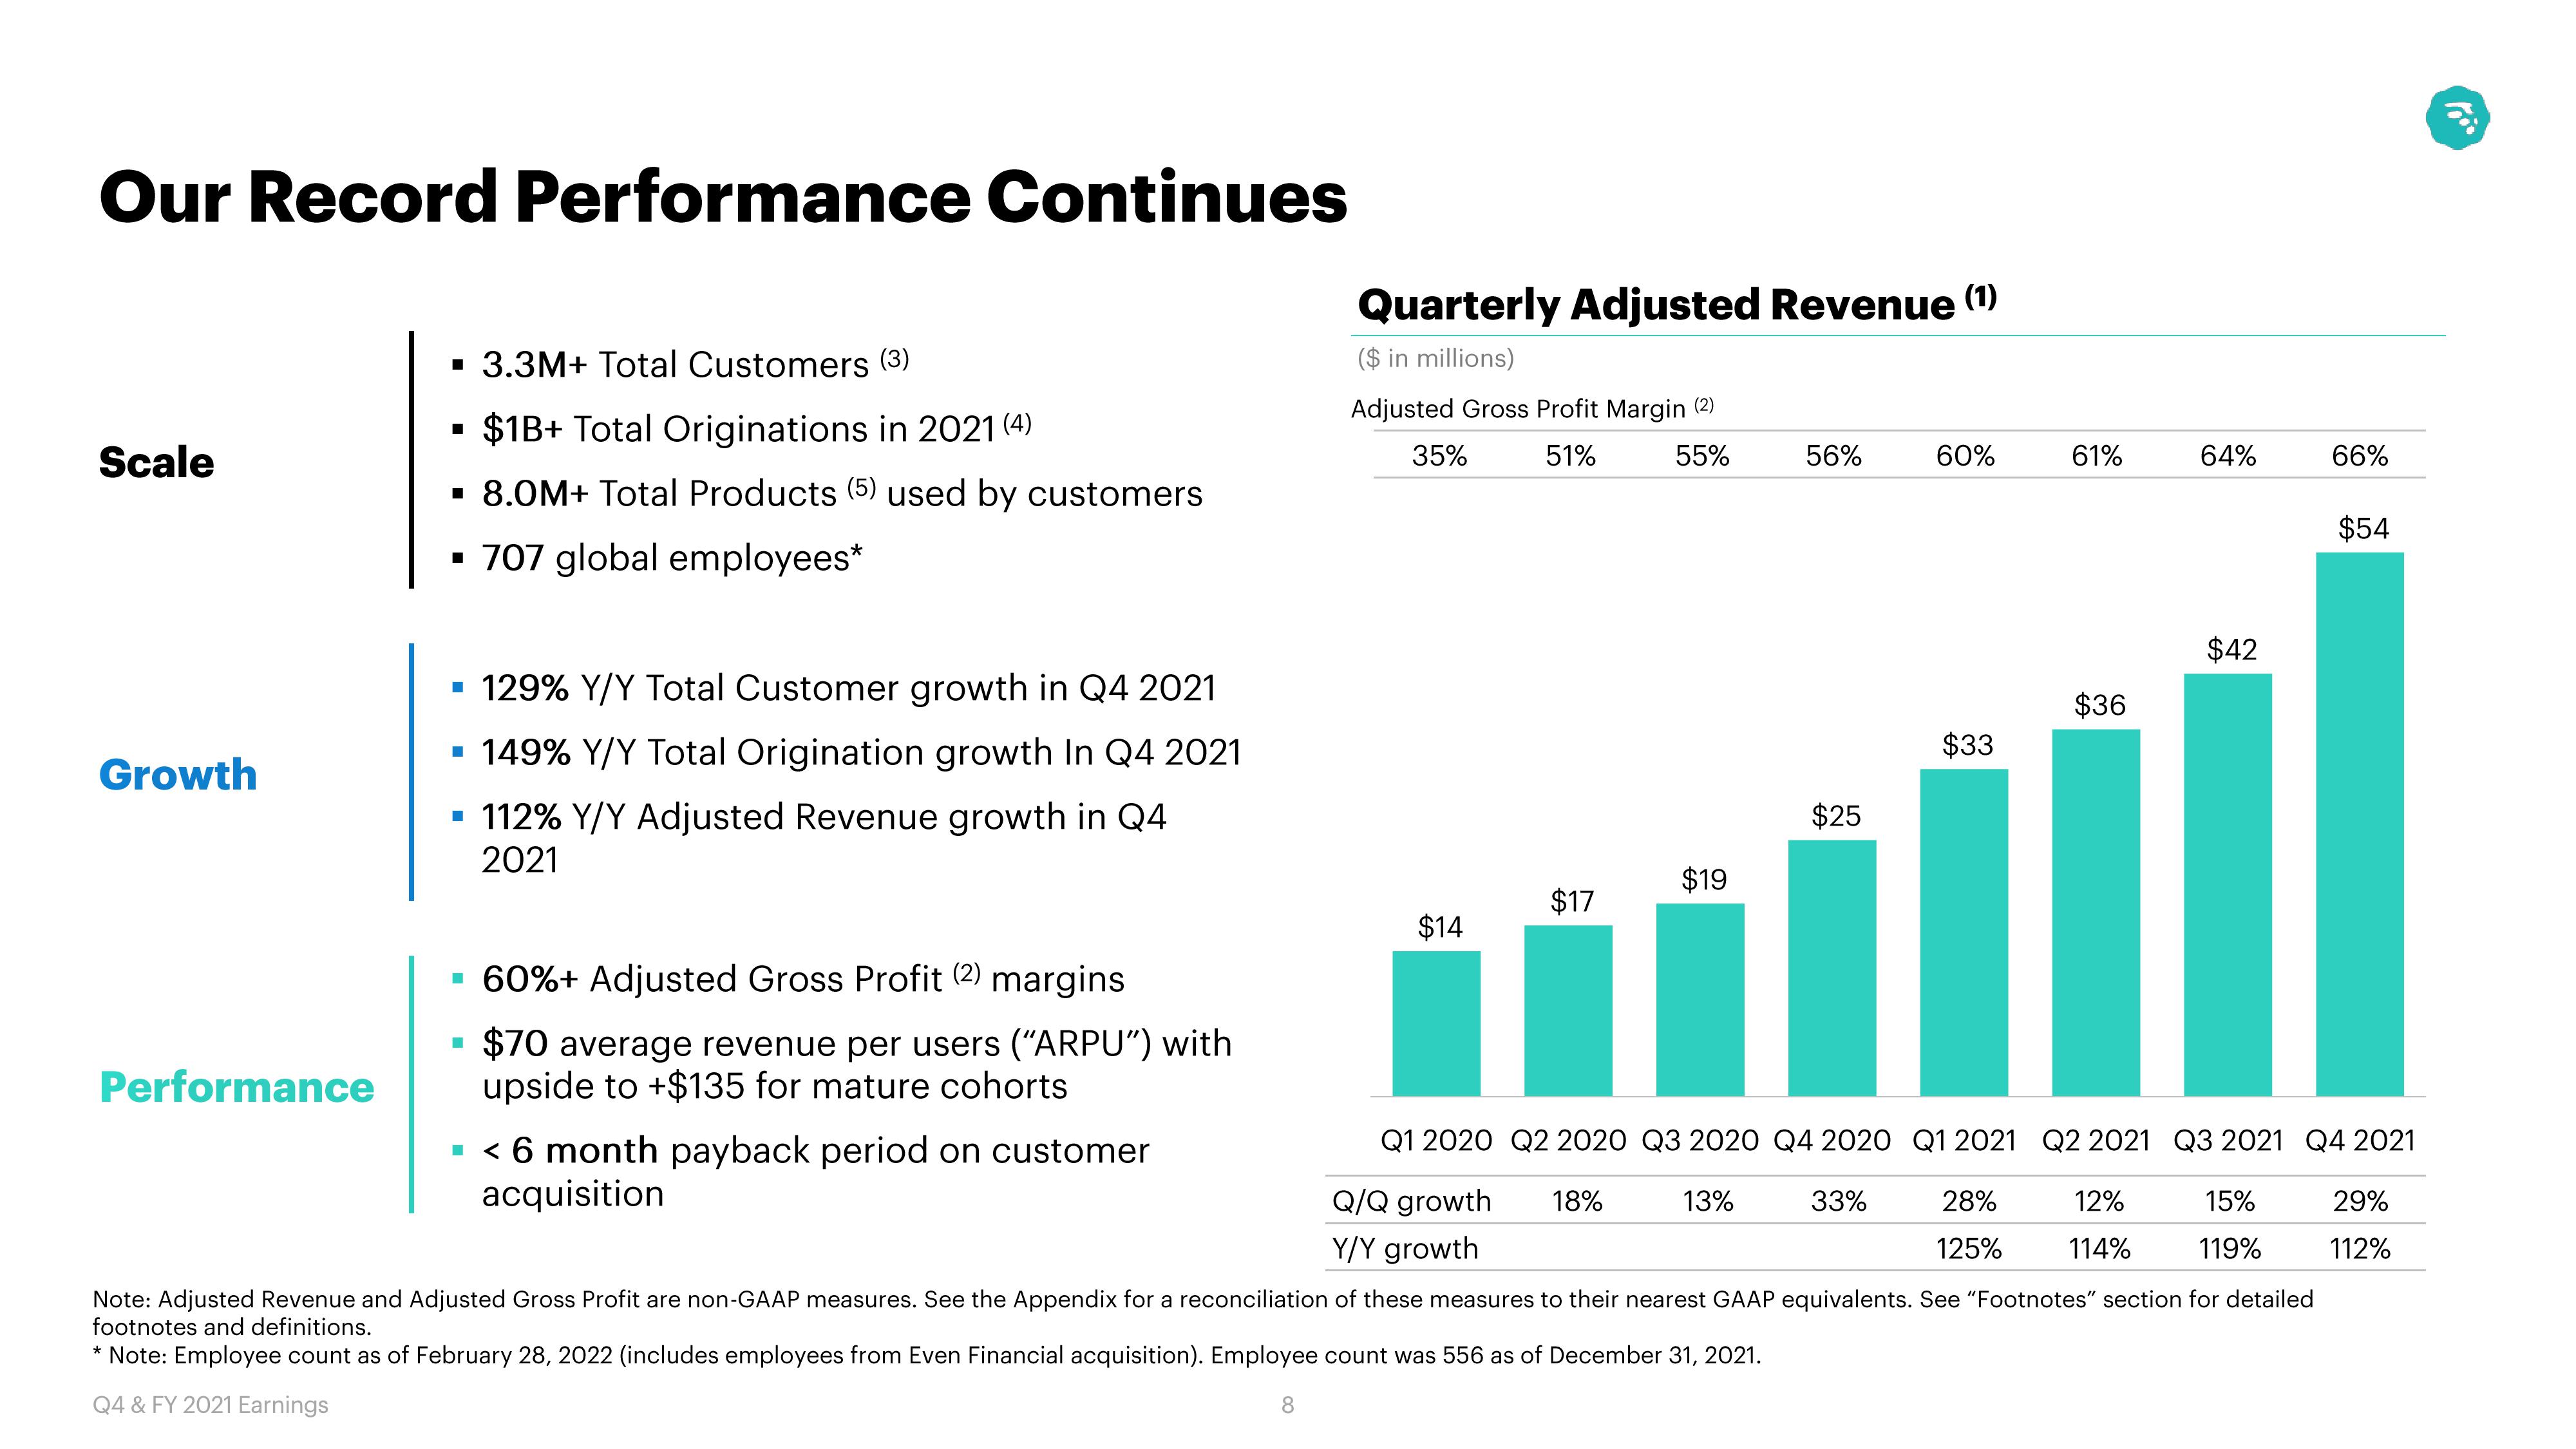
Our Record Performance Continues
Scale
Growth
Performance
▪ 3.3M+ Total Customers (3)
■
O $1B+ Total Originations in 2021 (4)
▪ 8.0M+ Total Products (5) used by customers
▪ 707 global employees*
▪ 129% Y/Y Total Customer growth in Q4 2021
▪ 149% Y/Y Total Origination growth In Q4 2021
▪ 112% Y/Y Adjusted Revenue growth in Q4
2021
▪ 60%+ Adjusted Gross Profit (2) margins
$70 average revenue per users ("ARPU") with
upside to +$135 for mature cohorts
■
Quarterly Adjusted Revenue (1)
($ in millions)
▪ < 6 month payback period on customer
acquisition
Adjusted Gross Profit Margin (2)
35%
51%
55%
$14
$17
$19
56%
13%
$25
60%
33%
$33
61%
$36
Q1 2020 Q2 2020 Q3 2020 Q4 2020 Q1 2021
Q/Q growth 18%
28%
Y/Y growth
125%
Note: Adjusted Revenue and Adjusted Gross Profit are non-GAAP measures. See the Appendix for a reconciliation of these measures to their nearest GAAP equivalents. See "Footnotes" section for detailed
footnotes and definitions.
* Note: Employee count as of February 28, 2022 (includes employees from Even Financial acquisition). Employee count was 556 as of December 31, 2021.
Q4 & FY 2021 Earnings
8
64%
$42
12%
114%
66%
Q2 2021 Q3 2021 Q4 2021
15%
119%
$54
29%
112%View entire presentation