Sonos Results Presentation Deck
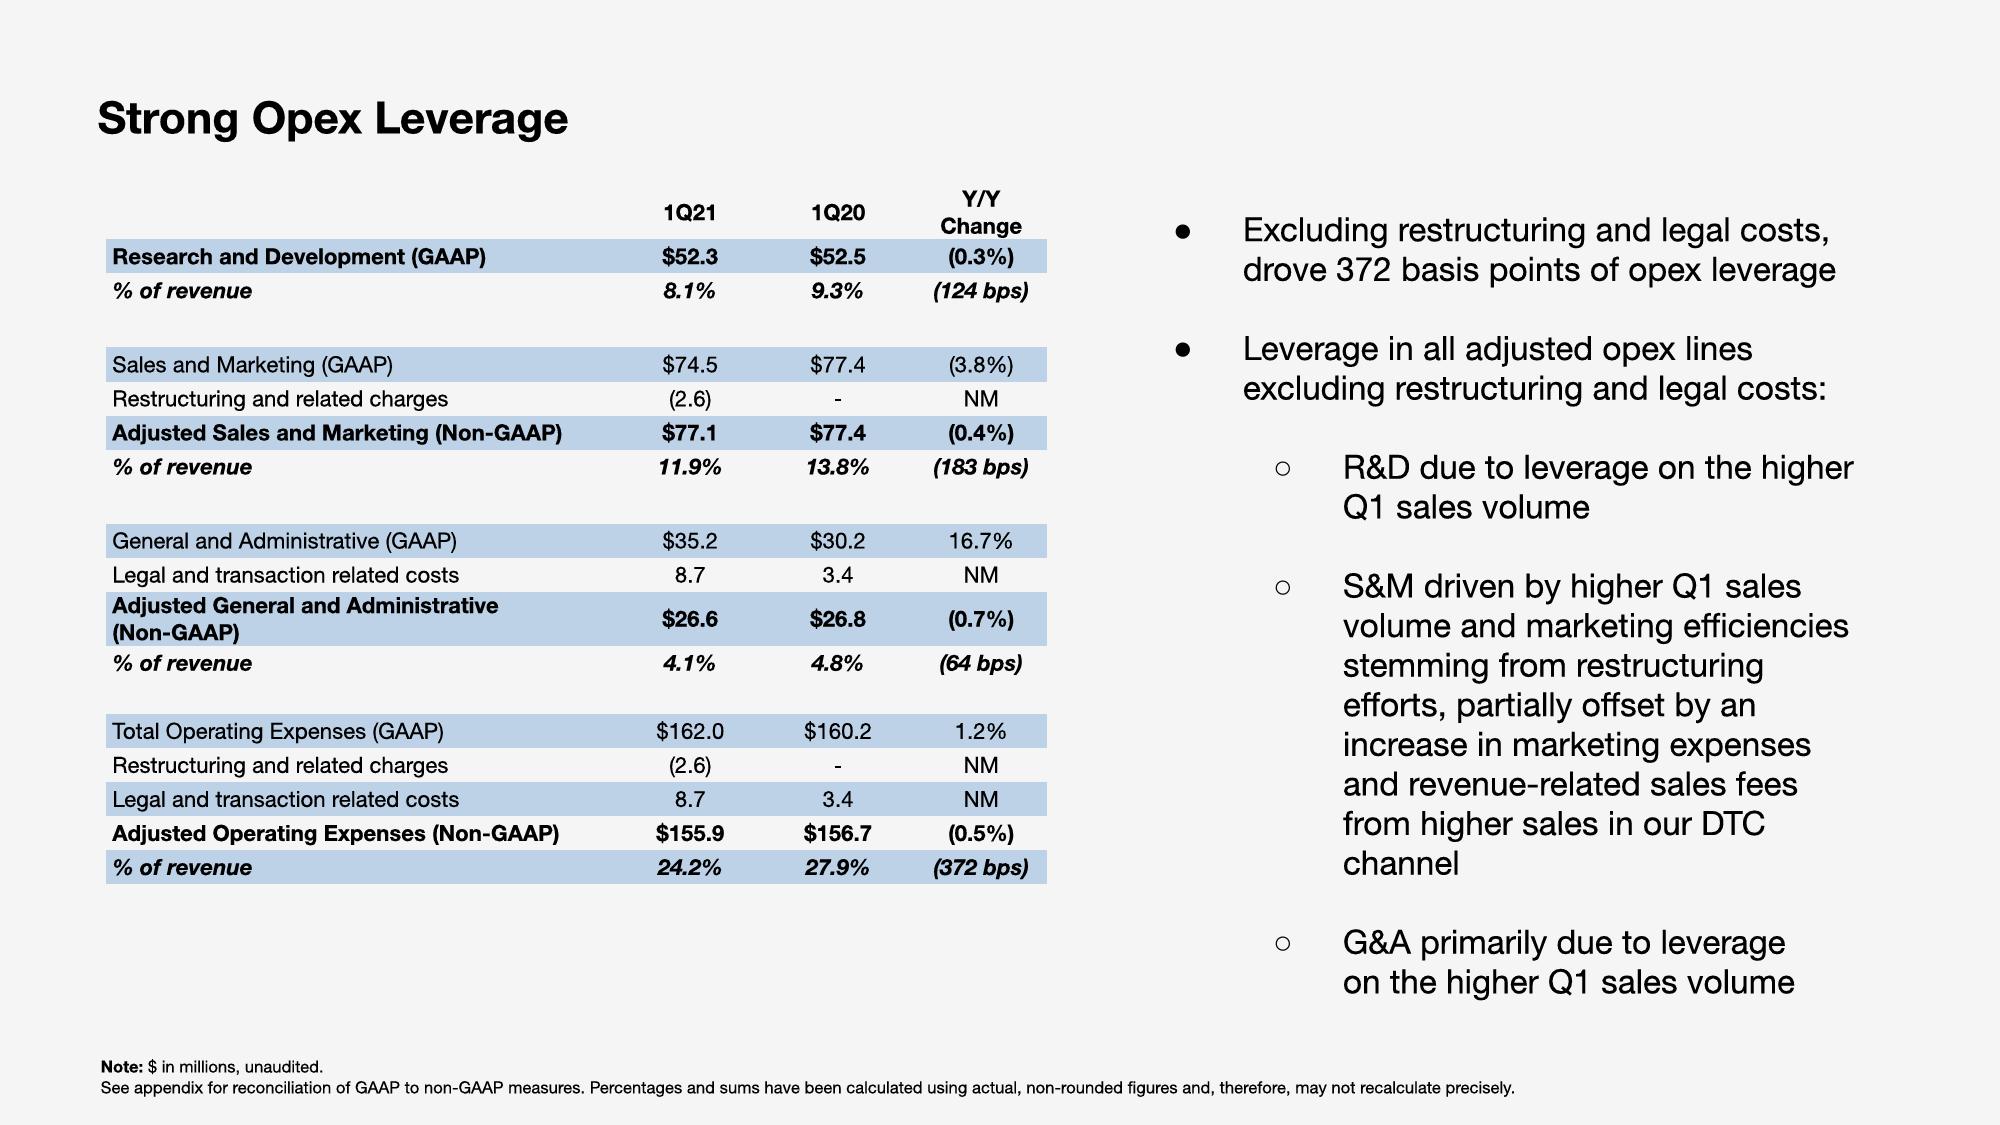
Strong Opex Leverage
Research and Development (GAAP)
% of revenue
Sales and Marketing (GAAP)
Restructuring and related charges
Adjusted Sales and Marketing (Non-GAAP)
% of revenue
General and Administrative (GAAP)
Legal and transaction related costs
Adjusted General and Administrative
(Non-GAAP)
% of revenue
Total Operating Expenses (GAAP)
Restructuring and related charges
Legal and transaction related costs
Adjusted Operating Expenses (Non-GAAP)
% of revenue
1Q21
$52.3
8.1%
$74.5
(2.6)
$77.1
11.9%
$35.2
8.7
$26.6
4.1%
$162.0
(2.6)
8.7
$155.9
24.2%
1Q20
$52.5
9.3%
$77.4
$77.4
13.8%
$30.2
3.4
$26.8
4.8%
$160.2
3.4
$156.7
27.9%
Y/Y
Change
(0.3%)
(124 bps)
(3.8%)
NM
(0.4%)
(183 bps)
16.7%
NM
(0.7%)
(64 bps)
1.2%
NM
NM
(0.5%)
(372 bps)
●
Excluding restructuring and legal costs,
drove 372 basis points of opex leverage
Leverage in all adjusted opex lines
excluding restructuring and legal costs:
R&D due to leverage on the higher
Q1 sales volume
O S&M driven by higher Q1 sales
volume and marketing efficiencies
stemming from restructuring
efforts, partially offset by an
increase in marketing expenses
and revenue-related sales fees
from higher sales in our DTC
channel
O
G&A primarily due to leverage
on the higher Q1 sales volume
Note: $ in millions, unaudited.
See appendix for reconciliation of GAAP to non-GAAP measures. Percentages and sums have been calculated using actual, non-rounded figures and, therefore, may not recalculate precisely.View entire presentation