Hanmi Financial Results Presentation Deck
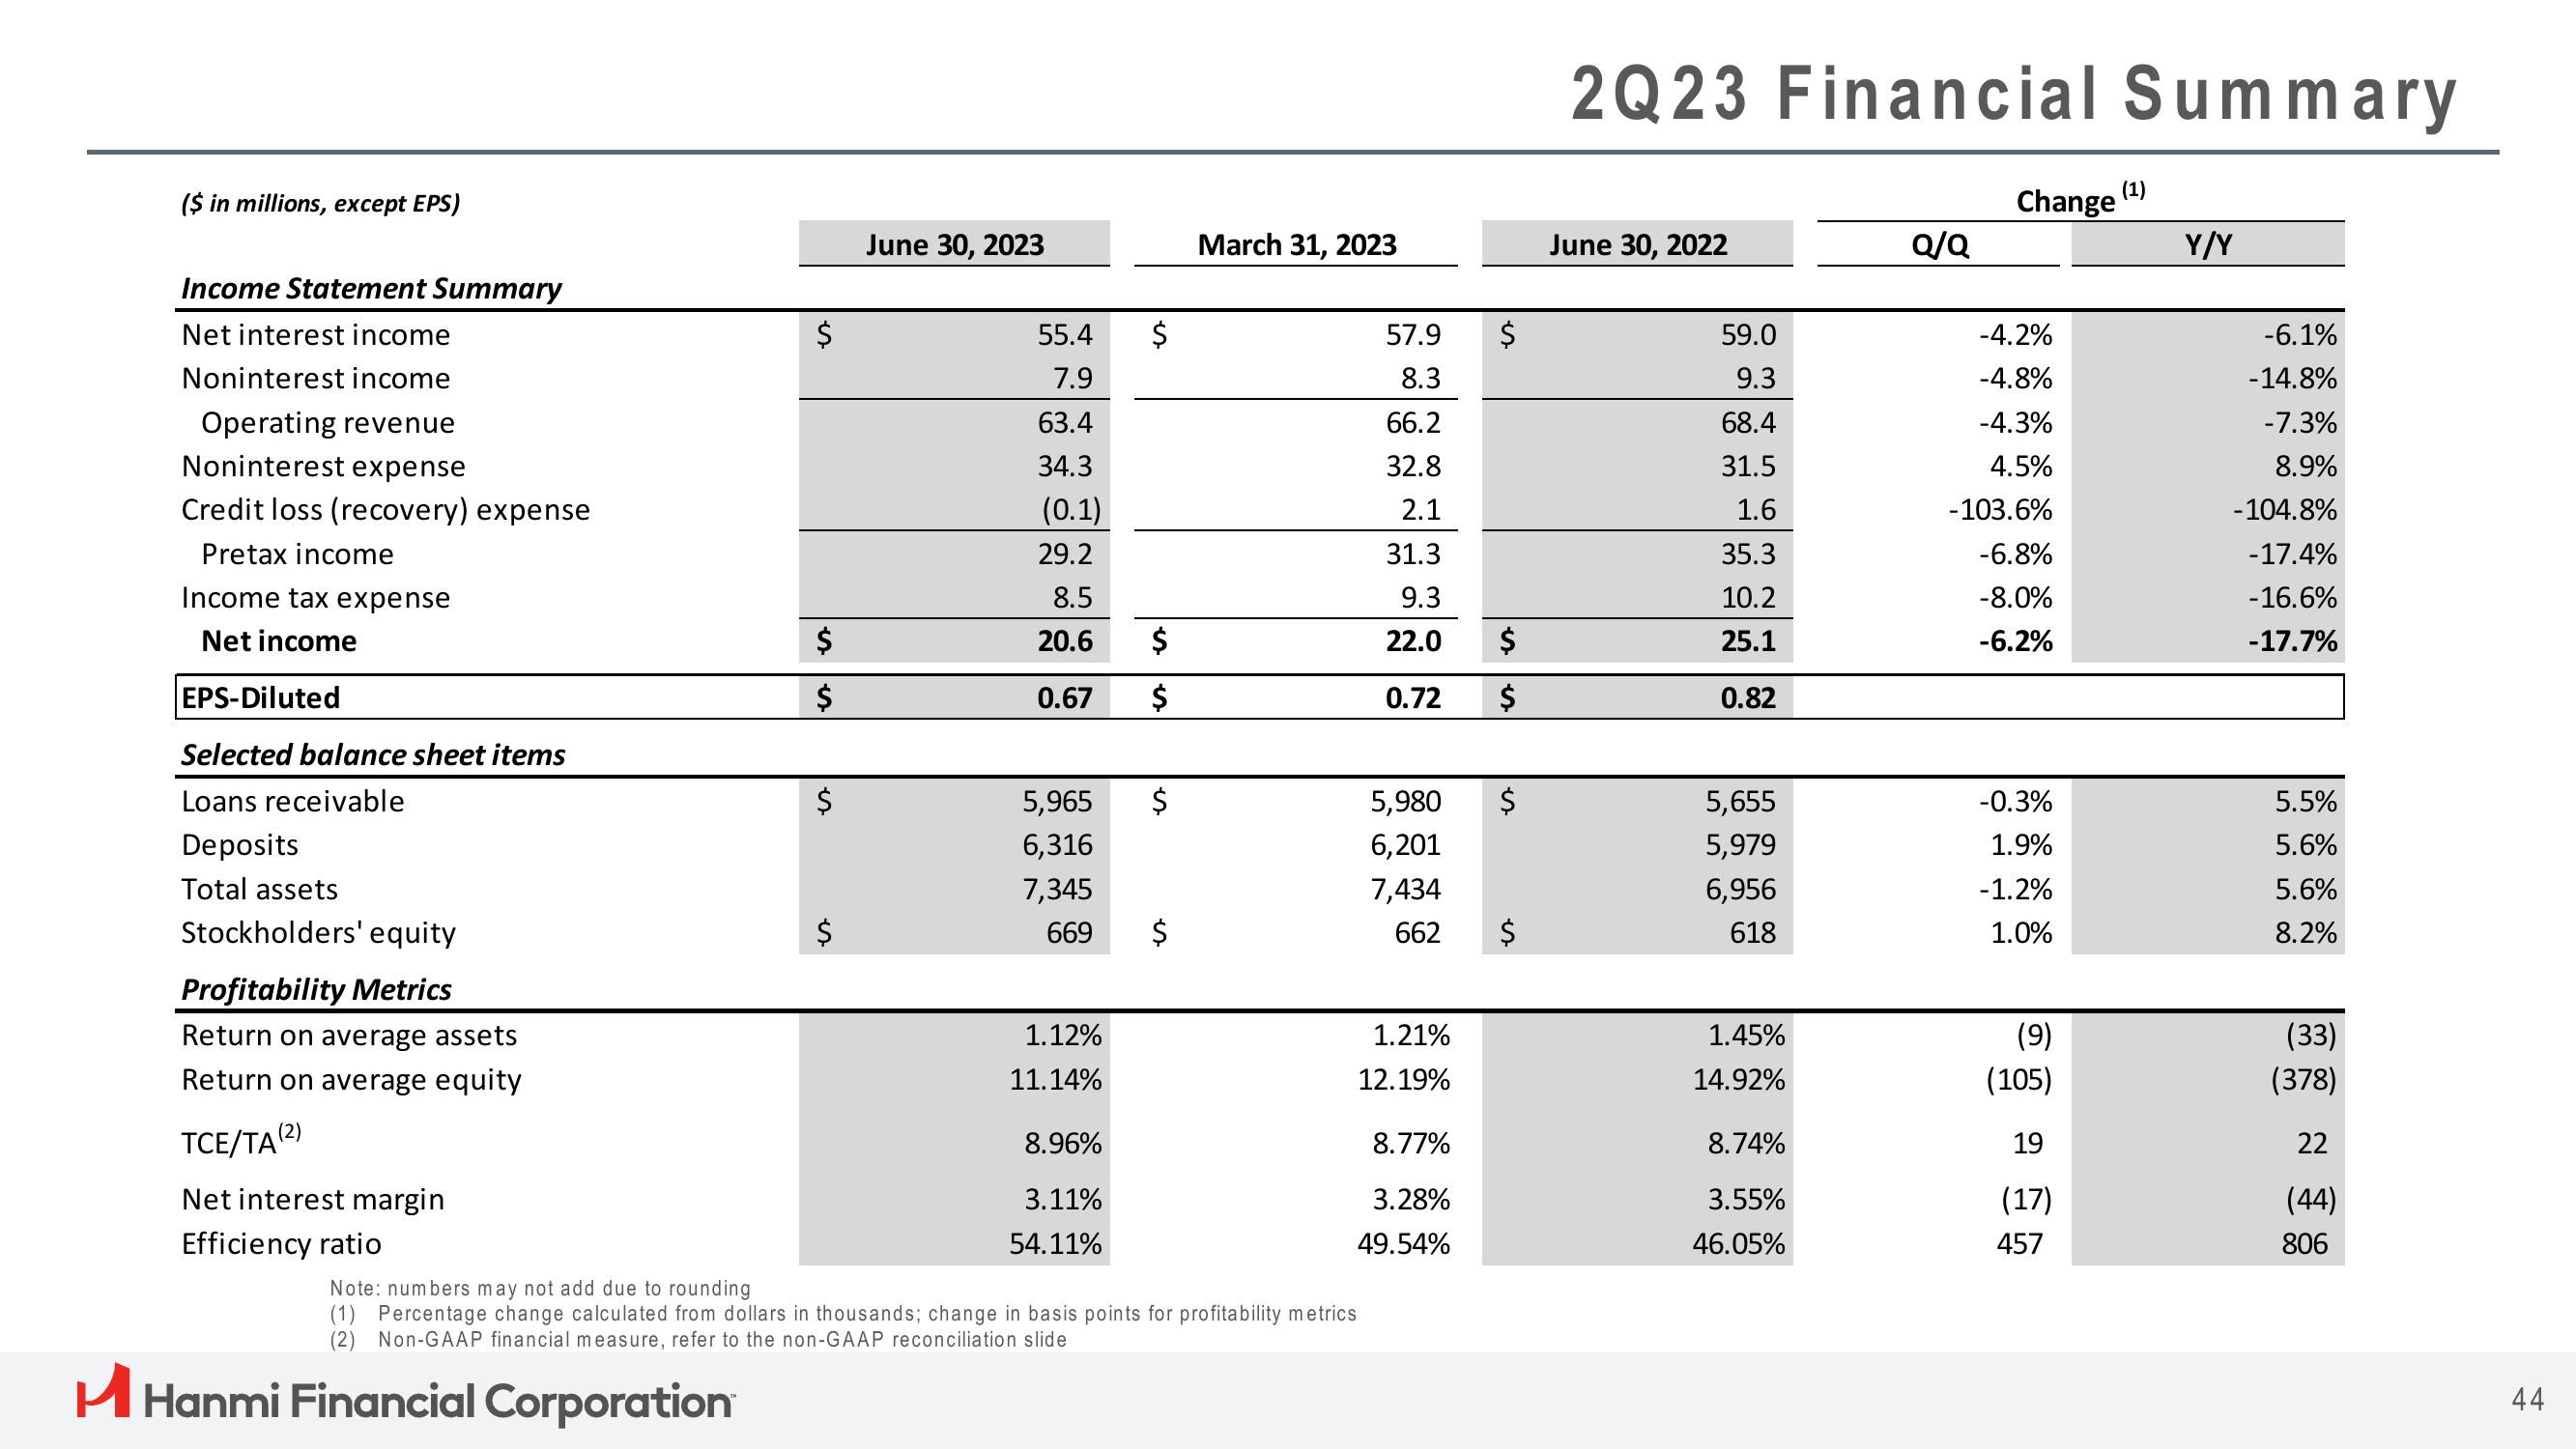
($ in millions, except EPS)
Income Statement Summary
Net interest income
Noninterest income
Operating revenue
Noninterest expense
Credit loss (recovery) expense
Pretax income
Income tax expense
Net income
EPS-Diluted
Selected balance sheet items
Loans receivable
Deposits
Total assets
Stockholders' equity
Profitability Metrics
Return on average assets
Return on average equity
TCE/TA (2)
Net interest margin
Efficiency ratio
$
H Hanmi Financial Corporation
$
$
$
$
June 30, 2023
55.4
7.9
63.4
34.3
(0.1)
29.2
8.5
20.6
0.67
1.12%
11.14%
$
5,965 $
6,316
7,345
669
8.96%
3.11%
54.11%
$
$
$
March 31, 2023
Note: numbers may not add due to rounding
(1) Percentage change calculated from dollars in thousands; change in basis points for profitability metrics
(2) Non-GAAP financial measure, refer to the non-GAAP reconciliation slide
57.9
8.3
66.2
32.8
2.1
31.3
9.3
22.0
0.72
5,980
6,201
7,434
662
1.21%
12.19%
8.77%
3.28%
49.54%
$
$
$
$
$
2Q23 Financial Summary
June 30, 2022
59.0
9.3
68.4
31.5
1.6
35.3
10.2
25.1
0.82
5,655
5,979
6,956
618
1.45%
14.92%
8.74%
3.55%
46.05%
Q/Q
Change
-4.2%
-4.8%
-4.3%
4.5%
-103.6%
-6.8%
-8.0%
-6.2%
-0.3%
1.9%
-1.2%
1.0%
(9)
(105)
19
(17)
(1)
Y/Y
-6.1%
-14.8%
-7.3%
8.9%
-104.8%
-17.4%
-16.6%
-17.7%
5.5%
5.6
5.6%
8.2%
(33)
(378)
22
(44)
806
44View entire presentation